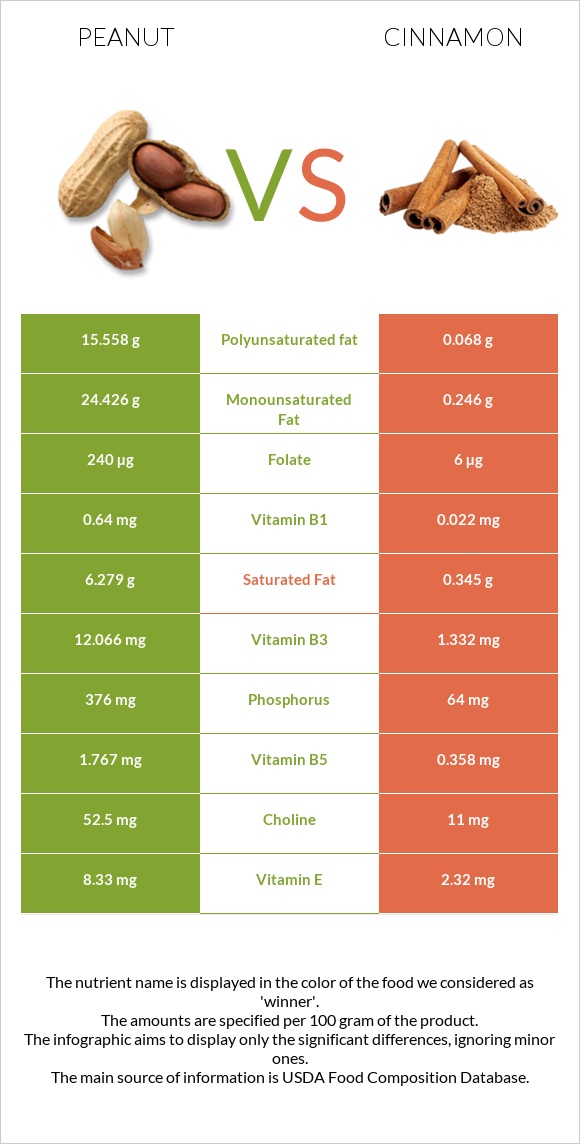
What are the differences between peanuts and cinnamon? Peanuts are higher in copper, vitamin B3, folate, vitamin B1, phosphorus, and vitamin E, yet cinnamon is higher in manganese, fiber, calcium, and iron. Cinnamon's daily need coverage for manganese is 675% more. Peanuts have 40 times more folate than cinnamon. While peanuts have 240µg of folate, cinnamon has only 6µg. We used Peanuts, all types, raw and Spices, cinnamon, ground types in this article.
Infographic
Mineral Comparison
Mineral comparison score is based on the number of minerals by which one or the other food is richer. The "coverage" charts below show how much of the daily needs can be covered by 300 grams of the food.
6
100 g
300 g
1 oz - 28.35g 1 cup - 146g
Magnesium
Magnesium
Calcium
Calcium
Potassium
Potassium
Iron
Iron
Copper
Copper
Zinc
Zinc
Phosphorus
Phosphorus
Sodium
Sodium
Manganese
Manganese
Selenium
Selenium
120%
28%
62%
172%
381%
89%
161%
2.3%
252%
39%
4
100 g
300 g
0.25 tsp - 0.5g 1 tbsp - 7.8g
Magnesium
Magnesium
Calcium
Calcium
Potassium
Potassium
Iron
Iron
Copper
Copper
Zinc
Zinc
Phosphorus
Phosphorus
Sodium
Sodium
Manganese
Manganese
Selenium
Selenium
43%
301%
38%
312%
113%
50%
27%
1.3%
2278%
17%
Vitamin Comparison
Vitamin comparison score is based on the number of vitamins by which one or the other food is richer. The "coverage" charts below show how much of the daily needs can be covered by 300 grams of the food.
7
100 g
300 g
1 oz - 28.35g 1 cup - 146g
Vitamin C
Vit. C
Vitamin D
Vit. D
Vitamin A
Vit. A
Vitamin E
Vit. E
Vitamin B1
Vit. B1
Vitamin B2
Vit. B2
Vitamin B3
Vit. B3
Vitamin B5
Vit. B5
Vitamin B6
Vit. B6
Vitamin B12
Vit. B12
Vitamin K
Vit. K
Folate
Folate
0%
0%
0%
167%
160%
31%
226%
106%
80%
0%
0%
180%
3
100 g
300 g
0.25 tsp - 0.5g 1 tbsp - 7.8g
Vitamin C
Vit. C
Vitamin D
Vit. D
Vitamin A
Vit. A
Vitamin E
Vit. E
Vitamin B1
Vit. B1
Vitamin B2
Vit. B2
Vitamin B3
Vit. B3
Vitamin B5
Vit. B5
Vitamin B6
Vit. B6
Vitamin B12
Vit. B12
Vitamin K
Vit. K
Folate
Folate
13%
0%
5%
46%
5.5%
9.5%
25%
21%
36%
0%
78%
4.5%
All nutrients comparison - raw data values
Nutrient
DV% diff.
Manganese
1.934mg
17.466mg
675%
Fiber
8.5g
53.1g
178%
Polyunsaturated fat
15.558g
0.068g
103%
Calcium
92mg
1002mg
91%
Copper
1.144mg
0.339mg
89%
Fats
49.24g
1.24g
74%
Vitamin B3
12.066mg
1.332mg
67%
Monounsaturated fat
24.426g
0.246g
60%
Folate
240µg
6µg
59%
Vitamin B1
0.64mg
0.022mg
52%
Iron
4.58mg
8.32mg
47%
Phosphorus
376mg
64mg
45%
Protein
25.8g
3.99g
44%
Vitamin E
8.33mg
2.32mg
40%
Vitamin B5
1.767mg
0.358mg
28%
Saturated fat
6.279g
0.345g
27%
Magnesium
168mg
60mg
26%
Vitamin K
0µg
31.2µg
26%
Carbs
16.13g
80.59g
21%
Calories
567kcal
247kcal
16%
Vitamin B6
0.348mg
0.158mg
15%
Zinc
3.27mg
1.83mg
13%
Potassium
705mg
431mg
8%
Choline
52.5mg
11mg
8%
Selenium
7.2µg
3.1µg
7%
Vitamin B2
0.135mg
0.041mg
7%
Vitamin C
0mg
3.8mg
4%
Vitamin A
0µg
15µg
2%
Fructose
1.11g
1%
Protein per 100 calories
4.6g
1.6g
N/A
Calories per 10 g protein
220kcal
619kcal
N/A
Weight per 100 calories
18g
40g
N/A
Unsaturated / Saturated Fat ratio
6.4
0.91
N/A
Net carbs
7.63g
27.49g
N/A
Sugar
4.72g
2.17g
N/A
Sodium
18mg
10mg
0%
Tryptophan
0.25mg
0.049mg
0%
Threonine
0.883mg
0.136mg
0%
Isoleucine
0.907mg
0.146mg
0%
Leucine
1.672mg
0.253mg
0%
Lysine
0.926mg
0.243mg
0%
Methionine
0.317mg
0.078mg
0%
Phenylalanine
1.377mg
0.146mg
0%
Valine
1.082mg
0.224mg
0%
Histidine
0.652mg
0.117mg
0%
Omega-3 - ALA
0.011g
N/A
Macronutrient Comparison
Macronutrient breakdown side-by-side comparison
2
26%
49%
16%
7%
2%
Protein:
25.8 g
Fats:
49.24 g
Carbs:
16.13 g
Water:
6.5 g
Other:
2.33 g
3
4%
81%
11%
4%
Protein:
3.99 g
Fats:
1.24 g
Carbs:
80.59 g
Water:
10.58 g
Other:
3.6 g
Contains
more
Protein Protein
+546.6%
Contains
more
Fats Fats
+3871%
Contains
more
Carbs Carbs
+399.6%
Contains
more
Water Water
+62.8%
Contains
more
Other Other
+54.5%
Fat Type Comparison
Fat type breakdown side-by-side comparison
2
14%
53%
34%
Saturated fat:
Sat. Fat
6.279 g
Monounsaturated fat:
Mono. Fat
24.426 g
Polyunsaturated fat:
Poly. Fat
15.558 g
1
52%
37%
10%
Saturated fat:
Sat. Fat
0.345 g
Monounsaturated fat:
Mono. Fat
0.246 g
Polyunsaturated fat:
Poly. Fat
0.068 g
Contains
more
Mono. Fat Monounsaturated fat
+9829.3%
Contains
more
Poly. Fat Polyunsaturated fat
+22779.4%
Contains
less
Sat. Fat Saturated fat
-94.5%