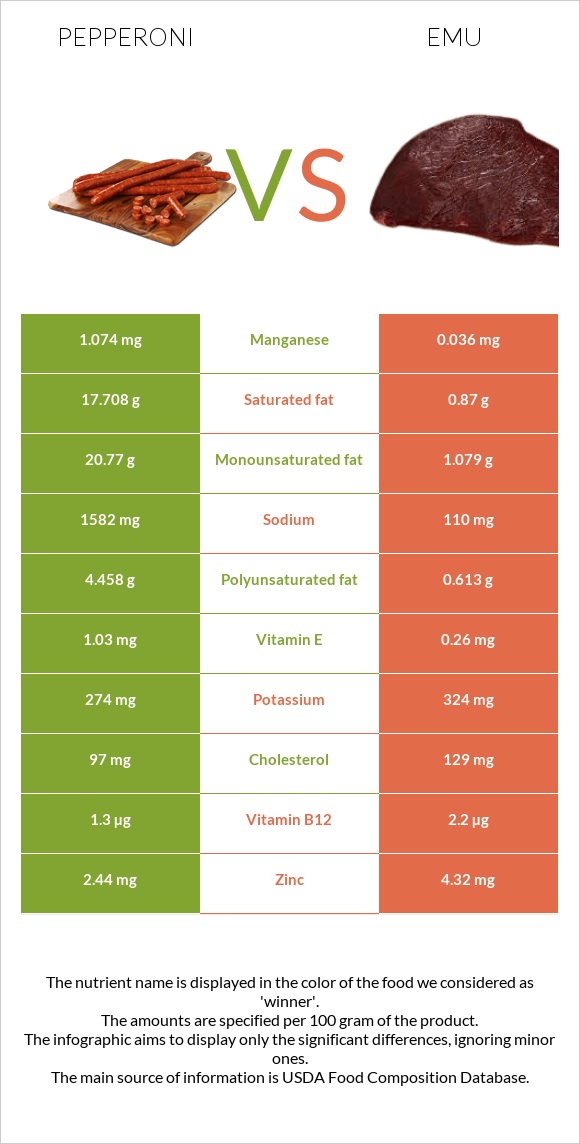
The main differences between pepperoni and emu Pepperoni is richer in manganese, yet emu is richer in iron, vitamin B5, vitamin B6, selenium, vitamin B12, vitamin B3, and vitamin B2. Daily need coverage for saturated fat for pepperoni is 84% higher. Pepperoni contains 30 times more manganese than emu. Pepperoni contains 1.074mg of manganese, while emu contains 0.036mg. Emu contains less saturated fat. Food types used in this article are Pepperoni, beef, and pork, sliced and Emu, full rump, cooked, broiled .
Infographic
Mineral Comparison
Mineral comparison score is based on the number of minerals by which one or the other food is richer. The "coverage" charts below show how much of the daily needs can be covered by 300 grams of the food.
2
100 g
300 g
1 piece - 2g 1 oz - 28g 3 oz - 85g
Magnesium
Magnesium
Calcium
Calcium
Potassium
Potassium
Iron
Iron
Copper
Copper
Zinc
Zinc
Phosphorus
Phosphorus
Sodium
Sodium
Manganese
Manganese
Selenium
Selenium
13%
5.7%
24%
50%
30%
67%
68%
206%
140%
158%
8
100 g
300 g
1 serving ( 3 oz ) - 85g 1 full rump cooked ( yield from 695 g raw meat ) - 496g
Magnesium
Magnesium
Calcium
Calcium
Potassium
Potassium
Iron
Iron
Copper
Copper
Zinc
Zinc
Phosphorus
Phosphorus
Sodium
Sodium
Manganese
Manganese
Selenium
Selenium
24%
2.1%
29%
258%
95%
118%
138%
14%
4.7%
284%
Vitamin Comparison
Vitamin comparison score is based on the number of vitamins by which one or the other food is richer. The "coverage" charts below show how much of the daily needs can be covered by 300 grams of the food.
3
100 g
300 g
1 piece - 2g 1 oz - 28g 3 oz - 85g
Vitamin C
Vit. C
Vitamin D
Vit. D
Vitamin A
Vit. A
Vitamin E
Vit. E
Vitamin B1
Vit. B1
Vitamin B2
Vit. B2
Vitamin B3
Vit. B3
Vitamin B5
Vit. B5
Vitamin B6
Vit. B6
Vitamin B12
Vit. B12
Vitamin K
Vit. K
Folate
Folate
0%
20%
0%
21%
68%
59%
94%
56%
84%
163%
15%
3.8%
8
100 g
300 g
1 serving ( 3 oz ) - 85g 1 full rump cooked ( yield from 695 g raw meat ) - 496g
Vitamin C
Vit. C
Vitamin D
Vit. D
Vitamin A
Vit. A
Vitamin E
Vit. E
Vitamin B1
Vit. B1
Vitamin B2
Vit. B2
Vitamin B3
Vit. B3
Vitamin B5
Vit. B5
Vitamin B6
Vit. B6
Vitamin B12
Vit. B12
Vitamin K
Vit. K
Folate
Folate
0%
0%
1%
5.2%
108%
149%
198%
219%
228%
275%
0%
7.5%
All nutrients comparison - raw data values
Nutrient
DV% diff.
Saturated fat
17.708g
0.87g
77%
Iron
1.33mg
6.89mg
70%
Fats
46.28g
2.68g
67%
Sodium
1582mg
110mg
64%
Vitamin B5
0.93mg
3.647mg
54%
Monounsaturated fat
20.77g
1.079g
49%
Vitamin B6
0.362mg
0.987mg
48%
Manganese
1.074mg
0.036mg
45%
Selenium
29µg
52.1µg
42%
Vitamin B12
1.3µg
2.2µg
38%
Vitamin B3
4.987mg
10.569mg
35%
Vitamin B2
0.257mg
0.645mg
30%
Protein
19.25g
33.67g
29%
Polyunsaturated fat
4.458g
0.613g
26%
Phosphorus
158mg
323mg
24%
Copper
0.091mg
0.285mg
22%
Calories
504kcal
168kcal
17%
Zinc
2.44mg
4.32mg
17%
Vitamin B1
0.271mg
0.43mg
13%
Cholesterol
97mg
129mg
11%
Choline
51.2mg
9%
Vitamin D*
52 IU
7%
Vitamin D
1.3µg
7%
Vitamin E
1.03mg
0.26mg
5%
Vitamin K
5.8µg
5%
Magnesium
18mg
34mg
4%
Calcium
19mg
7mg
1%
Potassium
274mg
324mg
1%
Folate
5µg
10µg
1%
Protein per 100 calories
3.8g
20g
N/A
Calories per 10 g protein
262kcal
50kcal
N/A
Weight per 100 calories
20g
60g
N/A
Unsaturated / Saturated Fat ratio
1.4
1.9
N/A
Net carbs
1.18g
0g
N/A
Carbs
1.18g
0g
0%
Vitamin A
0µg
3µg
0%
Trans fat
1.527g
N/A
Tryptophan
0.23mg
0.222mg
0%
Threonine
0.869mg
0.965mg
0%
Isoleucine
0.901mg
1.094mg
0%
Leucine
1.575mg
1.859mg
0%
Lysine
1.652mg
1.981mg
0%
Methionine
0.511mg
0.638mg
0%
Phenylalanine
0.778mg
0.961mg
0%
Valine
0.987mg
1.121mg
0%
Histidine
0.688mg
0.737mg
0%
Omega-3 - EPA
0.004g
0.01g
N/A
Omega-3 - DHA
0.004g
0.015g
N/A
Omega-3 - ALA
0.164g
N/A
Omega-3 - DPA
0.02g
N/A
Omega-3 - Eicosatrienoic acid
0.018g
N/A
Omega-6 - Gamma-linoleic acid
0.002g
N/A
Omega-6 - Dihomo-gamma-linoleic acid
0.04g
N/A
Omega-6 - Eicosadienoic acid
0.136g
0.003g
N/A
Omega-6 - Linoleic acid
3.605g
N/A
Macronutrient Comparison
Macronutrient breakdown side-by-side comparison
3
19%
46%
29%
5%
Protein:
19.25 g
Fats:
46.28 g
Carbs:
1.18 g
Water:
28.55 g
Other:
4.74 g
2
34%
3%
62%
2%
Protein:
33.67 g
Fats:
2.68 g
Carbs:
0 g
Water:
61.97 g
Other:
1.68 g
Contains
more
Fats Fats
+1626.9%
Contains
more
Carbs Carbs
+∞%
Contains
more
Other Other
+182.1%
Contains
more
Protein Protein
+74.9%
Contains
more
Water Water
+117.1%
Fat Type Comparison
Fat type breakdown side-by-side comparison
2
41%
48%
10%
Saturated fat:
Sat. Fat
17.708 g
Monounsaturated fat:
Mono. Fat
20.77 g
Polyunsaturated fat:
Poly. Fat
4.458 g
1
34%
42%
24%
Saturated fat:
Sat. Fat
0.87 g
Monounsaturated fat:
Mono. Fat
1.079 g
Polyunsaturated fat:
Poly. Fat
0.613 g
Contains
more
Mono. Fat Monounsaturated fat
+1824.9%
Contains
more
Poly. Fat Polyunsaturated fat
+627.2%
Contains
less
Sat. Fat Saturated fat
-95.1%