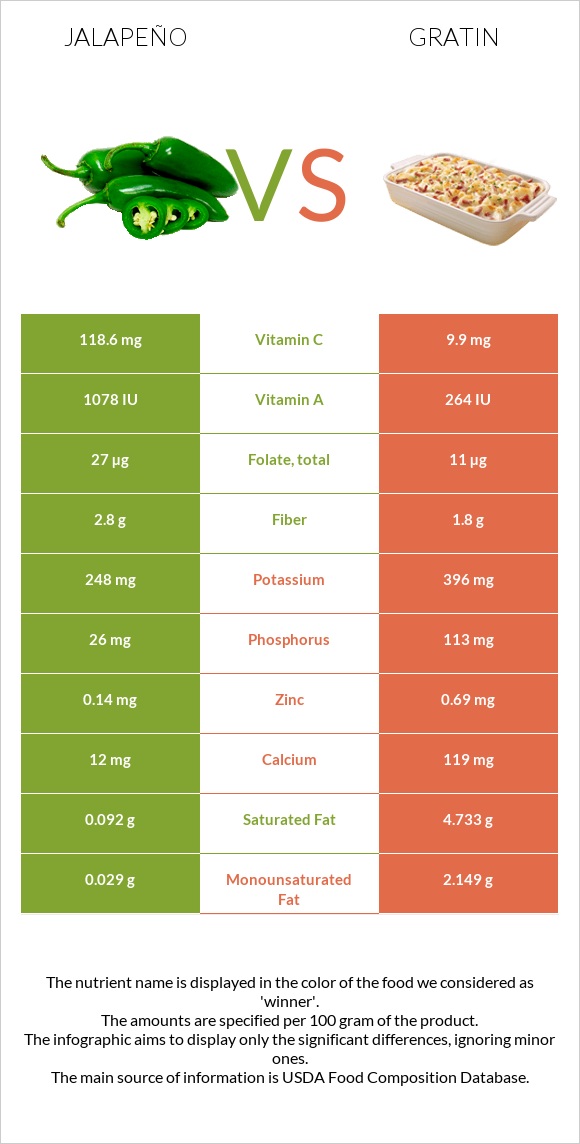
Important differences between jalapeño and gratin Jalapeño has more vitamin C, vitamin B6, and vitamin A; however, gratin has more copper, phosphorus, and calcium. Jalapeño's daily need coverage for vitamin C is 121% more. Jalapeño has 4 times more vitamin A than gratin. Jalapeño has 1078 IU of vitamin A, while gratin has 264 IU. Jalapeño is lower in saturated fat. The food varieties used in the comparison are Peppers, jalapeno, raw and Potatoes, au gratin, home-prepared from recipe using butter .
Infographic
Mineral Comparison
Mineral comparison score is based on the number of minerals by which one or the other food is richer. The "coverage" charts below show how much of the daily needs can be covered by 300 grams of the food.
1
100 g
300 g
1 pepper - 14g 1 cup, sliced - 90g
Magnesium
Magnesium
Calcium
Calcium
Potassium
Potassium
Iron
Iron
Copper
Copper
Zinc
Zinc
Phosphorus
Phosphorus
Sodium
Sodium
Manganese
Manganese
Selenium
Selenium
11%
3.6%
22%
9.4%
15%
3.8%
11%
0.39%
13%
2.2%
9
100 g
300 g
1 cup - 245g
Magnesium
Magnesium
Calcium
Calcium
Potassium
Potassium
Iron
Iron
Copper
Copper
Zinc
Zinc
Phosphorus
Phosphorus
Sodium
Sodium
Manganese
Manganese
Selenium
Selenium
14%
36%
35%
24%
53%
19%
48%
56%
21%
15%
Vitamin Comparison
Vitamin comparison score is based on the number of vitamins by which one or the other food is richer. The "coverage" charts below show how much of the daily needs can be covered by 300 grams of the food.
6
100 g
300 g
1 pepper - 14g 1 cup, sliced - 90g
Vitamin C
Vit. C
Vitamin D
Vit. D
Vitamin A
Vit. A
Vitamin E
Vit. E
Vitamin B1
Vit. B1
Vitamin B2
Vit. B2
Vitamin B3
Vit. B3
Vitamin B5
Vit. B5
Vitamin B6
Vit. B6
Vitamin B12
Vit. B12
Vitamin K
Vit. K
Folate
Folate
395%
0%
18%
72%
10%
16%
24%
19%
97%
0%
46%
20%
4
100 g
300 g
1 cup - 245g
Vitamin C
Vit. C
Vitamin D
Vit. D
Vitamin A
Vit. A
Vitamin E
Vit. E
Vitamin B1
Vit. B1
Vitamin B2
Vit. B2
Vitamin B3
Vit. B3
Vitamin B5
Vit. B5
Vitamin B6
Vit. B6
Vitamin B12
Vit. B12
Vitamin K
Vit. K
Folate
Folate
33%
0%
21%
0%
16%
27%
19%
23%
40%
0%
0%
8.3%
All nutrients comparison - raw data values
Nutrient
DV% diff.
Vitamin C
118.6mg
9.9mg
121%
Vitamin E
3.58mg
24%
Saturated fat
0.092g
4.733g
21%
Sodium
3mg
433mg
19%
Vitamin B6
0.419mg
0.174mg
19%
Vitamin K
18.5µg
15%
Copper
0.046mg
0.16mg
13%
Phosphorus
26mg
113mg
12%
Fats
0.37g
7.59g
11%
Calcium
12mg
119mg
11%
Protein
0.91g
5.06g
8%
Cholesterol
0mg
23mg
8%
Calories
29kcal
132kcal
5%
Iron
0.25mg
0.64mg
5%
Zinc
0.14mg
0.69mg
5%
Monounsaturated fat
0.029g
2.149g
5%
Potassium
248mg
396mg
4%
Fiber
2.8g
1.8g
4%
Selenium
0.4µg
2.7µg
4%
Vitamin B2
0.07mg
0.116mg
4%
Folate
27µg
11µg
4%
Manganese
0.097mg
0.161mg
3%
Fructose
2.63g
3%
Carbs
6.5g
11.27g
2%
Vitamin B1
0.04mg
0.064mg
2%
Vitamin B3
1.28mg
0.993mg
2%
Magnesium
15mg
20mg
1%
Vitamin A
54µg
64µg
1%
Vitamin B5
0.315mg
0.387mg
1%
Choline
7.5mg
1%
Polyunsaturated fat
0.112g
0.276g
1%
Protein per 100 calories
3.1g
3.8g
N/A
Calories per 10 g protein
319kcal
261kcal
N/A
Weight per 100 calories
345g
76g
N/A
Unsaturated / Saturated Fat ratio
1.5
0.51
N/A
Net carbs
3.7g
9.47g
N/A
Sugar
4.12g
N/A
Tryptophan
0.07mg
0%
Threonine
0.192mg
0%
Isoleucine
0.284mg
0%
Leucine
0.443mg
0%
Lysine
0.381mg
0%
Methionine
0.117mg
0%
Phenylalanine
0.254mg
0%
Valine
0.325mg
0%
Histidine
0.151mg
0%
Omega-3 - ALA
0.05g
N/A
Omega-6 - Linoleic acid
0.062g
N/A
Macronutrient Comparison
Macronutrient breakdown side-by-side comparison
1
7%
92%
Protein:
0.91 g
Fats:
0.37 g
Carbs:
6.5 g
Water:
91.69 g
Other:
0.53 g
4
5%
8%
11%
74%
2%
Protein:
5.06 g
Fats:
7.59 g
Carbs:
11.27 g
Water:
74 g
Other:
2.08 g
Contains
more
Water Water
+23.9%
Contains
more
Protein Protein
+456%
Contains
more
Fats Fats
+1951.4%
Contains
more
Carbs Carbs
+73.4%
Contains
more
Other Other
+292.5%
Fat Type Comparison
Fat type breakdown side-by-side comparison
1
39%
12%
48%
Saturated fat:
Sat. Fat
0.092 g
Monounsaturated fat:
Mono. Fat
0.029 g
Polyunsaturated fat:
Poly. Fat
0.112 g
2
66%
30%
4%
Saturated fat:
Sat. Fat
4.733 g
Monounsaturated fat:
Mono. Fat
2.149 g
Polyunsaturated fat:
Poly. Fat
0.276 g
Contains
less
Sat. Fat Saturated fat
-98.1%
Contains
more
Mono. Fat Monounsaturated fat
+7310.3%
Contains
more
Poly. Fat Polyunsaturated fat
+146.4%