Persimmon vs. Gumdrop — In-Depth Nutrition Comparison
Compare
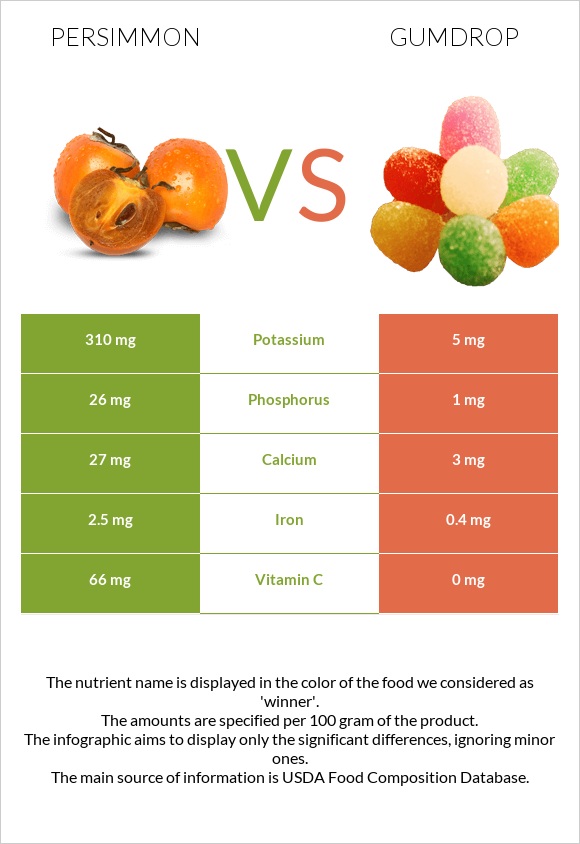
Differences between persimmon and gumdrop
- Gumdrop contains less vitamin C, iron, and potassium than persimmon.
- Persimmon's daily need coverage for vitamin C is 73% higher.
- Gumdrop contains 62 times less potassium than persimmon. Persimmon contains 310mg of potassium, while gumdrop contains 5mg.
- Persimmon has a lower glycemic index. The glycemic index of persimmon is 61, while the glycemic index of gumdrop is 78.
The food types used in this comparison are Persimmons, native, raw and Candies, gumdrops, starch jelly pieces.
Infographic
Infographic link
Mineral Comparison
Mineral comparison score is based on the number of minerals by which one or the other food is richer. The "coverage" charts below show how much of the daily needs can be covered by 300 grams of the food.
| Contains more CalciumCalcium | +800% |
| Contains more PotassiumPotassium | +6100% |
| Contains more IronIron | +525% |
| Contains more PhosphorusPhosphorus | +2500% |
| Contains less SodiumSodium | -97.7% |
Vitamin Comparison
Vitamin comparison score is based on the number of vitamins by which one or the other food is richer. The "coverage" charts below show how much of the daily needs can be covered by 300 grams of the food.
| Contains more Vitamin CVitamin C | +∞% |
All nutrients comparison - raw data values
| Nutrient |  |
 |
DV% diff. |
| Vitamin C | 66mg | 0mg | 73% |
| Iron | 2.5mg | 0.4mg | 26% |
| Carbs | 33.5g | 98.9g | 22% |
| Calories | 127kcal | 396kcal | 13% |
| Potassium | 310mg | 5mg | 9% |
| Phosphorus | 26mg | 1mg | 4% |
| Protein | 0.8g | 0g | 2% |
| Calcium | 27mg | 3mg | 2% |
| Sodium | 1mg | 44mg | 2% |
| Fats | 0.4g | 0g | 1% |
| Copper | 0.012mg | 1% | |
| Selenium | 0.8µg | 1% | |
| Vitamin B1 | 0.006mg | 1% | |
| Vitamin B2 | 0.013mg | 1% | |
| Net carbs | 33.5g | 98.8g | N/A |
| Magnesium | 1mg | 0% | |
| Sugar | 58.97g | N/A | |
| Fiber | 0.1g | 0% | |
| Manganese | 0.01mg | 0% | |
| Vitamin B3 | 0.01mg | 0% | |
| Vitamin B5 | 0.012mg | 0% | |
| Vitamin B6 | 0.005mg | 0% | |
| Tryptophan | 0.014mg | 0% | |
| Threonine | 0.041mg | 0% | |
| Isoleucine | 0.035mg | 0% | |
| Leucine | 0.058mg | 0% | |
| Lysine | 0.045mg | 0% | |
| Methionine | 0.007mg | 0% | |
| Phenylalanine | 0.036mg | 0% | |
| Valine | 0.042mg | 0% | |
| Histidine | 0.016mg | 0% |
Macronutrient Comparison
Macronutrient breakdown side-by-side comparison
| Contains more ProteinProtein | +∞% |
| Contains more FatsFats | +∞% |
| Contains more WaterWater | +6340% |
| Contains more OtherOther | +800% |
| Contains more CarbsCarbs | +195.2% |


