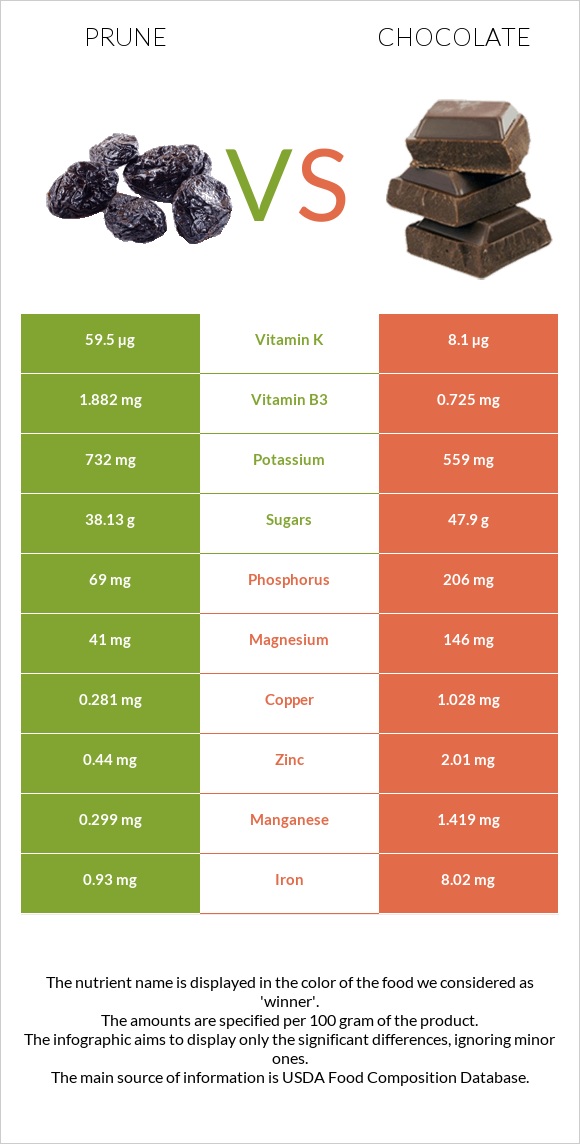
Summary of differences between prunes and chocolate Prunes have more vitamin K, vitamin A, and vitamin B6, while chocolate has more iron, copper, manganese, magnesium, phosphorus, and zinc. Chocolate covers your daily need for saturated fat, 92% more than prunes. Prunes contain 16 times more vitamin A than chocolate. While prunes contain 781 IU of vitamin A, chocolate contains only 50 IU. The amount of saturated fat in prunes is lower. These are the specific foods used in this comparison Plums, dried (prunes), uncooked and Chocolate, dark, 45- 59% cacao solids .
Infographic
Mineral Comparison
Mineral comparison score is based on the number of minerals by which one or the other food is richer. The "coverage" charts below show how much of the daily needs can be covered by 300 grams of the food.
2
100 g
300 g
1 prune, pitted - 9.5g 1 cup, pitted - 174g
Magnesium
Magnesium
Calcium
Calcium
Potassium
Potassium
Iron
Iron
Copper
Copper
Zinc
Zinc
Phosphorus
Phosphorus
Sodium
Sodium
Manganese
Manganese
Selenium
Selenium
29%
13%
65%
35%
94%
12%
30%
0.26%
39%
1.6%
8
100 g
300 g
1 oz - 28.35g 1 bar - 162g
Magnesium
Magnesium
Calcium
Calcium
Potassium
Potassium
Iron
Iron
Copper
Copper
Zinc
Zinc
Phosphorus
Phosphorus
Sodium
Sodium
Manganese
Manganese
Selenium
Selenium
104%
17%
49%
301%
343%
55%
88%
3.1%
185%
16%
Vitamin Comparison
Vitamin comparison score is based on the number of vitamins by which one or the other food is richer. The "coverage" charts below show how much of the daily needs can be covered by 300 grams of the food.
9
100 g
300 g
1 prune, pitted - 9.5g 1 cup, pitted - 174g
Vitamin C
Vit. C
Vitamin D
Vit. D
Vitamin A
Vit. A
Vitamin E
Vit. E
Vitamin B1
Vit. B1
Vitamin B2
Vit. B2
Vitamin B3
Vit. B3
Vitamin B5
Vit. B5
Vitamin B6
Vit. B6
Vitamin B12
Vit. B12
Vitamin K
Vit. K
Folate
Folate
2%
0%
13%
8.6%
13%
43%
35%
25%
47%
0%
149%
3%
2
100 g
300 g
1 oz - 28.35g 1 bar - 162g
Vitamin C
Vit. C
Vitamin D
Vit. D
Vitamin A
Vit. A
Vitamin E
Vit. E
Vitamin B1
Vit. B1
Vitamin B2
Vit. B2
Vitamin B3
Vit. B3
Vitamin B5
Vit. B5
Vitamin B6
Vit. B6
Vitamin B12
Vit. B12
Vitamin K
Vit. K
Folate
Folate
0%
0%
0.67%
11%
6.3%
12%
14%
18%
9.7%
29%
20%
0%
All nutrients comparison - raw data values
Nutrient
DV% diff.
Iron
0.93mg
8.02mg
89%
Saturated fat
0.088g
18.519g
84%
Copper
0.281mg
1.028mg
83%
Manganese
0.299mg
1.419mg
49%
Fats
0.38g
31.28g
48%
Vitamin K
59.5µg
8.1µg
43%
Magnesium
41mg
146mg
25%
Monounsaturated fat
0.053g
9.54g
24%
Phosphorus
69mg
206mg
20%
Fructose
12.45g
0g
16%
Calories
240kcal
546kcal
15%
Zinc
0.44mg
2.01mg
14%
Vitamin B6
0.205mg
0.042mg
13%
Caffeine
0mg
43mg
11%
Vitamin B2
0.186mg
0.05mg
10%
Vitamin B12
0µg
0.23µg
10%
Vitamin B3
1.882mg
0.725mg
7%
Polyunsaturated fat
0.062g
1.092g
7%
Protein
2.18g
4.88g
5%
Potassium
732mg
559mg
5%
Selenium
0.3µg
3µg
5%
Vitamin A
39µg
2µg
4%
Cholesterol
0mg
8mg
3%
Vitamin B5
0.422mg
0.297mg
3%
Starch
5.11g
2%
Vitamin B1
0.051mg
0.025mg
2%
Choline
10.1mg
2%
Vitamin C
0.6mg
1%
Carbs
63.88g
61.17g
1%
Calcium
43mg
56mg
1%
Sodium
2mg
24mg
1%
Vitamin E
0.43mg
0.54mg
1%
Folate
4µg
1%
Weight per 100 calories
42g
18g
N/A
Unsaturated / Saturated Fat ratio
1.3
0.57
N/A
Net carbs
56.78g
54.17g
N/A
Sugar
38.13g
47.9g
N/A
Fiber
7.1g
7g
0%
Trans fat
0.112g
N/A
Tryptophan
0.025mg
0%
Threonine
0.049mg
0%
Isoleucine
0.041mg
0%
Leucine
0.066mg
0%
Lysine
0.05mg
0%
Methionine
0.016mg
0%
Phenylalanine
0.052mg
0%
Valine
0.056mg
0%
Histidine
0.027mg
0%
Omega-3 - EPA
0g
0.001g
N/A
Omega-3 - ALA
0.085g
N/A
Omega-6 - Eicosadienoic acid
0g
0.001g
N/A
Omega-6 - Linoleic acid
0.947g
N/A
Macronutrient Comparison
Macronutrient breakdown side-by-side comparison
3
2%
64%
31%
3%
Protein:
2.18 g
Fats:
0.38 g
Carbs:
63.88 g
Water:
30.92 g
Other:
2.64 g
2
5%
31%
61%
2%
Protein:
4.88 g
Fats:
31.28 g
Carbs:
61.17 g
Water:
0.97 g
Other:
1.7 g
Contains
more
Water Water
+3087.6%
Contains
more
Other Other
+55.3%
Contains
more
Protein Protein
+123.9%
Contains
more
Fats Fats
+8131.6%
Fat Type Comparison
Fat type breakdown side-by-side comparison
1
43%
26%
31%
Saturated fat:
Sat. Fat
0.088 g
Monounsaturated fat:
Mono. Fat
0.053 g
Polyunsaturated fat:
Poly. Fat
0.062 g
2
64%
33%
4%
Saturated fat:
Sat. Fat
18.519 g
Monounsaturated fat:
Mono. Fat
9.54 g
Polyunsaturated fat:
Poly. Fat
1.092 g
Contains
less
Sat. Fat Saturated fat
-99.5%
Contains
more
Mono. Fat Monounsaturated fat
+17900%
Contains
more
Poly. Fat Polyunsaturated fat
+1661.3%
Carbohydrate type comparison
Carbohydrate type breakdown side-by-side comparison
4
12%
59%
29%
Starch:
5.11 g
Sucrose:
0.15 g
Glucose:
25.46 g
Fructose:
12.45 g
Lactose:
0 g
Maltose:
0.06 g
Galactose:
0 g
2
97%
3%
Starch:
0 g
Sucrose:
46.25 g
Glucose:
0 g
Fructose:
0 g
Lactose:
1.65 g
Maltose:
0 g
Galactose:
0 g
Contains
more
Starch Starch
+∞%
Contains
more
Glucose Glucose
+∞%
Contains
more
Fructose Fructose
+∞%
Contains
more
Maltose Maltose
+∞%
Contains
more
Sucrose Sucrose
+30733.3%
Contains
more
Lactose Lactose
+∞%