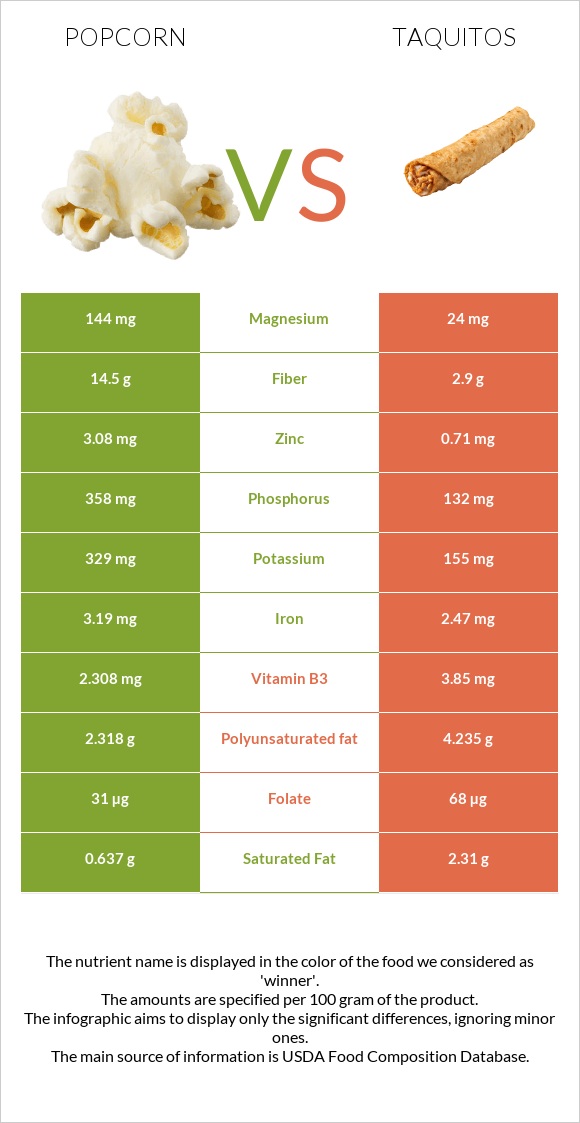
Significant differences between popcorn and taquitos Popcorn has more fiber, phosphorus, manganese, magnesium, zinc, and copper; however, taquitos are richer in selenium, vitamin B1, and vitamin B2. Popcorn covers your daily fiber needs 46% more than taquitos. Taquitos have 6 times less magnesium than popcorn. Popcorn has 144mg of magnesium, while taquitos have 24mg. Popcorn contains less sodium. Popcorn has a higher glycemic index. The glycemic index of popcorn is 62, while the glycemic index of taquitos is 49. Specific food types used in this comparison are Snacks, popcorn, air-popped and Taquitos, frozen, chicken, and cheese, oven-heated .
Infographic
Mineral Comparison
Mineral comparison score is based on the number of minerals by which one or the other food is richer. The "coverage" charts below show how much of the daily needs can be covered by 300 grams of the food.
8
100 g
300 g
1 cup - 8g 1 oz - 28.35g
Magnesium
Magnesium
Calcium
Calcium
Potassium
Potassium
Iron
Iron
Copper
Copper
Zinc
Zinc
Phosphorus
Phosphorus
Sodium
Sodium
Manganese
Manganese
Selenium
Selenium
103%
2.1%
29%
120%
87%
84%
153%
1%
145%
0%
2
100 g
300 g
1 piece - 42g
Magnesium
Magnesium
Calcium
Calcium
Potassium
Potassium
Iron
Iron
Copper
Copper
Zinc
Zinc
Phosphorus
Phosphorus
Sodium
Sodium
Manganese
Manganese
Selenium
Selenium
17%
31%
14%
93%
33%
19%
57%
59%
50%
91%
Vitamin Comparison
Vitamin comparison score is based on the number of vitamins by which one or the other food is richer. The "coverage" charts below show how much of the daily needs can be covered by 300 grams of the food.
1
100 g
300 g
1 cup - 8g 1 oz - 28.35g
Vitamin C
Vit. C
Vitamin D
Vit. D
Vitamin A
Vit. A
Vitamin E
Vit. E
Vitamin B1
Vit. B1
Vitamin B2
Vit. B2
Vitamin B3
Vit. B3
Vitamin B5
Vit. B5
Vitamin B6
Vit. B6
Vitamin B12
Vit. B12
Vitamin K
Vit. K
Folate
Folate
0%
0%
3.3%
5.8%
26%
19%
43%
31%
36%
0%
3%
23%
9
100 g
300 g
1 piece - 42g
Vitamin C
Vit. C
Vitamin D
Vit. D
Vitamin A
Vit. A
Vitamin E
Vit. E
Vitamin B1
Vit. B1
Vitamin B2
Vit. B2
Vitamin B3
Vit. B3
Vitamin B5
Vit. B5
Vitamin B6
Vit. B6
Vitamin B12
Vit. B12
Vitamin K
Vit. K
Folate
Folate
0%
1.5%
10%
23%
83%
64%
72%
29%
32%
23%
42%
51%
All nutrients comparison - raw data values
Nutrient
DV% diff.
Fiber
14.5g
2.9g
46%
Phosphorus
358mg
132mg
32%
Manganese
1.113mg
0.387mg
32%
Selenium
0µg
16.7µg
30%
Magnesium
144mg
24mg
29%
Zinc
3.08mg
0.71mg
22%
Sodium
8mg
453mg
19%
Vitamin B1
0.104mg
0.331mg
19%
Copper
0.262mg
0.1mg
18%
Carbs
77.78g
33.63g
15%
Vitamin B2
0.083mg
0.277mg
15%
Vitamin K
1.2µg
16.9µg
13%
Polyunsaturated fat
2.318g
4.235g
13%
Fats
4.54g
12.54g
12%
Calcium
7mg
104mg
10%
Starch
54.4g
29.62g
10%
Vitamin B3
2.308mg
3.85mg
10%
Monounsaturated fat
0.95g
4.835g
10%
Iron
3.19mg
2.47mg
9%
Folate
31µg
68µg
9%
Vitamin B12
0µg
0.18µg
8%
Saturated fat
0.637g
2.31g
8%
Protein
12.94g
9.21g
7%
Vitamin E
0.29mg
1.13mg
6%
Calories
387kcal
284kcal
5%
Potassium
329mg
155mg
5%
Cholesterol
0mg
13mg
4%
Vitamin A
10µg
30µg
2%
Vitamin D
0µg
0.1µg
1%
Vitamin B5
0.51mg
0.481mg
1%
Vitamin B6
0.157mg
0.14mg
1%
Choline
21.2mg
15.9mg
1%
Protein per 100 calories
3.3g
3.2g
N/A
Calories per 10 g protein
299kcal
308kcal
N/A
Weight per 100 calories
26g
35g
N/A
Unsaturated / Saturated Fat ratio
5.1
3.9
N/A
Net carbs
63.28g
30.73g
N/A
Vitamin D*
0 IU
3 IU
0%
Sugar
0.87g
1.3g
N/A
Trans fat
0.071g
N/A
Tryptophan
0.085mg
0.1mg
0%
Threonine
0.452mg
0.269mg
0%
Isoleucine
0.431mg
0.358mg
0%
Leucine
1.473mg
0.717mg
0%
Lysine
0.338mg
0.468mg
0%
Methionine
0.252mg
0.189mg
0%
Phenylalanine
0.59mg
0.418mg
0%
Valine
0.607mg
0.428mg
0%
Histidine
0.367mg
0.249mg
0%
Fructose
0.07g
0.12g
0%
Omega-3 - ALA
0.593g
N/A
Omega-6 - Dihomo-gamma-linoleic acid
0.003g
N/A
Omega-6 - Eicosadienoic acid
0g
0.005g
N/A
Omega-6 - Linoleic acid
3.591g
N/A
Macronutrient Comparison
Macronutrient breakdown side-by-side comparison
2
13%
5%
78%
3%
Protein:
12.94 g
Fats:
4.54 g
Carbs:
77.78 g
Water:
3.32 g
Other:
1.42 g
3
9%
13%
34%
43%
2%
Protein:
9.21 g
Fats:
12.54 g
Carbs:
33.63 g
Water:
42.74 g
Other:
1.88 g
Contains
more
Protein Protein
+40.5%
Contains
more
Carbs Carbs
+131.3%
Contains
more
Fats Fats
+176.2%
Contains
more
Water Water
+1187.3%
Contains
more
Other Other
+32.4%
Fat Type Comparison
Fat type breakdown side-by-side comparison
1
16%
24%
59%
Saturated fat:
Sat. Fat
0.637 g
Monounsaturated fat:
Mono. Fat
0.95 g
Polyunsaturated fat:
Poly. Fat
2.318 g
2
20%
42%
37%
Saturated fat:
Sat. Fat
2.31 g
Monounsaturated fat:
Mono. Fat
4.835 g
Polyunsaturated fat:
Poly. Fat
4.235 g
Contains
less
Sat. Fat Saturated fat
-72.4%
Contains
more
Mono. Fat Monounsaturated fat
+408.9%
Contains
more
Poly. Fat Polyunsaturated fat
+82.7%
Carbohydrate type comparison
Carbohydrate type breakdown side-by-side comparison
2
98%
Starch:
54.4 g
Sucrose:
0.72 g
Glucose:
0.07 g
Fructose:
0.07 g
Lactose:
0 g
Maltose:
0 g
Galactose:
0 g
3
96%
3%
Starch:
29.62 g
Sucrose:
0.3 g
Glucose:
0.09 g
Fructose:
0.12 g
Lactose:
0 g
Maltose:
0.78 g
Galactose:
0 g
Contains
more
Starch Starch
+83.7%
Contains
more
Sucrose Sucrose
+140%
Contains
more
Glucose Glucose
+28.6%
Contains
more
Fructose Fructose
+71.4%
Contains
more
Maltose Maltose
+∞%
~equal in
Lactose
~0g
~equal in
Galactose
~0g