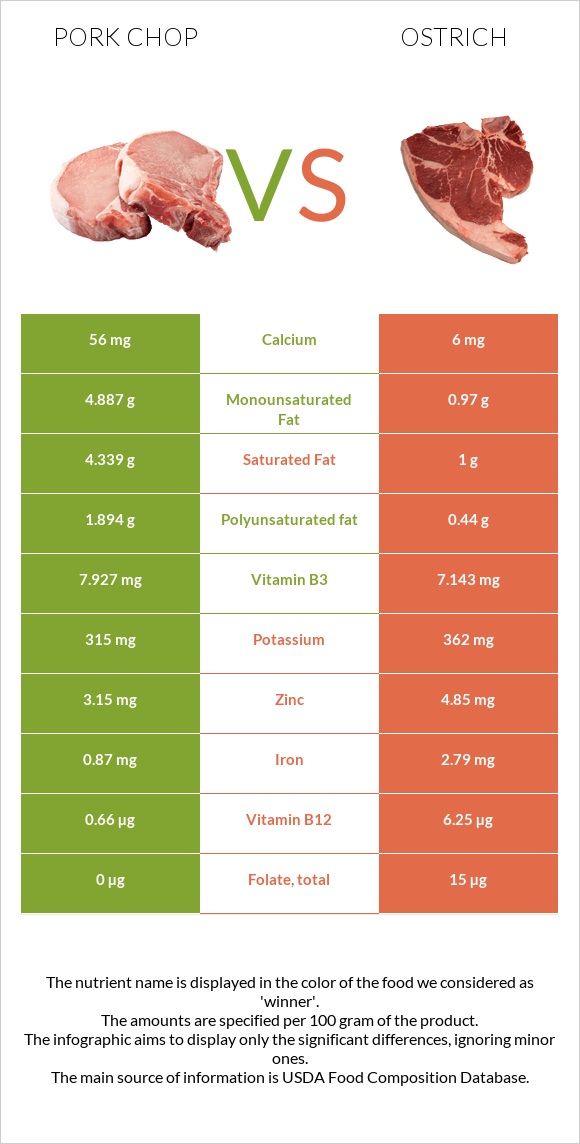
What are the main differences between pork chop and ostrich? Pork chop is richer in vitamin B1, yet ostrich is richer in vitamin B12, iron, zinc, and copper. Ostrich's daily need coverage for vitamin B12 is 233% higher. Pork chop has 9 times more calcium than ostrich. Pork chop has 56mg of calcium, while ostrich has 6mg. Ostrich contains less saturated fat. We used Pork, fresh, loin, blade (chops), bone-in, separable lean, and fat, cooked, broiled and Ostrich, tip trimmed, cooked types in this comparison.
Infographic
Mineral Comparison
Mineral comparison score is based on the number of minerals by which one or the other food is richer. The "coverage" charts below show how much of the daily needs can be covered by 300 grams of the food.
1
100 g
300 g
3 oz - 85g 1 chop - 219g
Magnesium
Magnesium
Calcium
Calcium
Potassium
Potassium
Iron
Iron
Copper
Copper
Zinc
Zinc
Phosphorus
Phosphorus
Sodium
Sodium
Manganese
Manganese
Selenium
Selenium
14%
17%
28%
33%
35%
86%
103%
9.7%
1.3%
199%
6
100 g
300 g
1 serving ( 3 oz ) - 85g
Magnesium
Magnesium
Calcium
Calcium
Potassium
Potassium
Iron
Iron
Copper
Copper
Zinc
Zinc
Phosphorus
Phosphorus
Sodium
Sodium
Manganese
Manganese
Selenium
Selenium
18%
1.8%
32%
105%
51%
132%
108%
10%
2.5%
205%
Vitamin Comparison
Vitamin comparison score is based on the number of vitamins by which one or the other food is richer. The "coverage" charts below show how much of the daily needs can be covered by 300 grams of the food.
3
100 g
300 g
3 oz - 85g 1 chop - 219g
Vitamin C
Vit. C
Vitamin D
Vit. D
Vitamin A
Vit. A
Vitamin E
Vit. E
Vitamin B1
Vit. B1
Vitamin B2
Vit. B2
Vitamin B3
Vit. B3
Vitamin B5
Vit. B5
Vitamin B6
Vit. B6
Vitamin B12
Vit. B12
Vitamin K
Vit. K
Folate
Folate
0%
15%
1.3%
4.2%
123%
72%
149%
66%
113%
83%
0%
0%
4
100 g
300 g
1 serving ( 3 oz ) - 85g
Vitamin C
Vit. C
Vitamin D
Vit. D
Vitamin A
Vit. A
Vitamin E
Vit. E
Vitamin B1
Vit. B1
Vitamin B2
Vit. B2
Vitamin B3
Vit. B3
Vitamin B5
Vit. B5
Vitamin B6
Vit. B6
Vitamin B12
Vit. B12
Vitamin K
Vit. K
Folate
Folate
0%
0%
0%
4.6%
58%
67%
134%
79%
126%
781%
0%
11%
All nutrients comparison - raw data values
Nutrient
DV% diff.
Vitamin B12
0.66µg
6.25µg
233%
Iron
0.87mg
2.79mg
24%
Vitamin B1
0.49mg
0.232mg
22%
Fats
14.35g
2.57g
18%
Zinc
3.15mg
4.85mg
15%
Saturated fat
4.339g
1g
15%
Choline
67.5mg
12%
Protein
23.72g
28.49g
10%
Monounsaturated fat
4.887g
0.97g
10%
Polyunsaturated fat
1.894g
0.44g
10%
Vitamin D*
40 IU
5%
Vitamin D
1µg
5%
Calcium
56mg
6mg
5%
Copper
0.105mg
0.152mg
5%
Vitamin B3
7.927mg
7.143mg
5%
Calories
231kcal
145kcal
4%
Vitamin B5
1.104mg
1.318mg
4%
Vitamin B6
0.489mg
0.545mg
4%
Folate
0µg
15µg
4%
Cholesterol
78mg
85mg
2%
Selenium
36.4µg
37.5µg
2%
Vitamin B2
0.313mg
0.292mg
2%
Magnesium
20mg
25mg
1%
Potassium
315mg
362mg
1%
Phosphorus
241mg
251mg
1%
Protein per 100 calories
10g
20g
N/A
Calories per 10 g protein
97kcal
51kcal
N/A
Weight per 100 calories
43g
69g
N/A
Unsaturated / Saturated Fat ratio
1.6
1.4
N/A
Sodium
74mg
80mg
0%
Vitamin A
4µg
0µg
0%
Vitamin E
0.21mg
0.23mg
0%
Manganese
0.01mg
0.019mg
0%
Trans fat
0.066g
N/A
Tryptophan
0.282mg
0.254mg
0%
Threonine
1.043mg
1.25mg
0%
Isoleucine
1.123mg
1.354mg
0%
Leucine
1.952mg
2.315mg
0%
Lysine
2.109mg
2.516mg
0%
Methionine
0.65mg
0.796mg
0%
Phenylalanine
0.985mg
1.176mg
0%
Valine
1.2mg
1.407mg
0%
Histidine
0.965mg
0.716mg
0%
Omega-3 - DHA
0.001g
N/A
Omega-3 - ALA
0.065g
N/A
Omega-3 - DPA
0.011g
N/A
Omega-6 - Gamma-linoleic acid
0.003g
N/A
Omega-6 - Eicosadienoic acid
0.065g
N/A
Omega-6 - Linoleic acid
0.922g
N/A
Macronutrient Comparison
Macronutrient breakdown side-by-side comparison
2
24%
14%
61%
Protein:
23.72 g
Fats:
14.35 g
Carbs:
0 g
Water:
61.45 g
Other:
0.48 g
2
28%
3%
69%
Protein:
28.49 g
Fats:
2.57 g
Carbs:
0 g
Water:
68.51 g
Other:
0.43 g
Contains
more
Fats Fats
+458.4%
Contains
more
Other Other
+11.6%
Contains
more
Protein Protein
+20.1%
Contains
more
Water Water
+11.5%
Fat Type Comparison
Fat type breakdown side-by-side comparison
2
39%
44%
17%
Saturated fat:
Sat. Fat
4.339 g
Monounsaturated fat:
Mono. Fat
4.887 g
Polyunsaturated fat:
Poly. Fat
1.894 g
1
41%
40%
18%
Saturated fat:
Sat. Fat
1 g
Monounsaturated fat:
Mono. Fat
0.97 g
Polyunsaturated fat:
Poly. Fat
0.44 g
Contains
more
Mono. Fat Monounsaturated fat
+403.8%
Contains
more
Poly. Fat Polyunsaturated fat
+330.5%
Contains
less
Sat. Fat Saturated fat
-77%