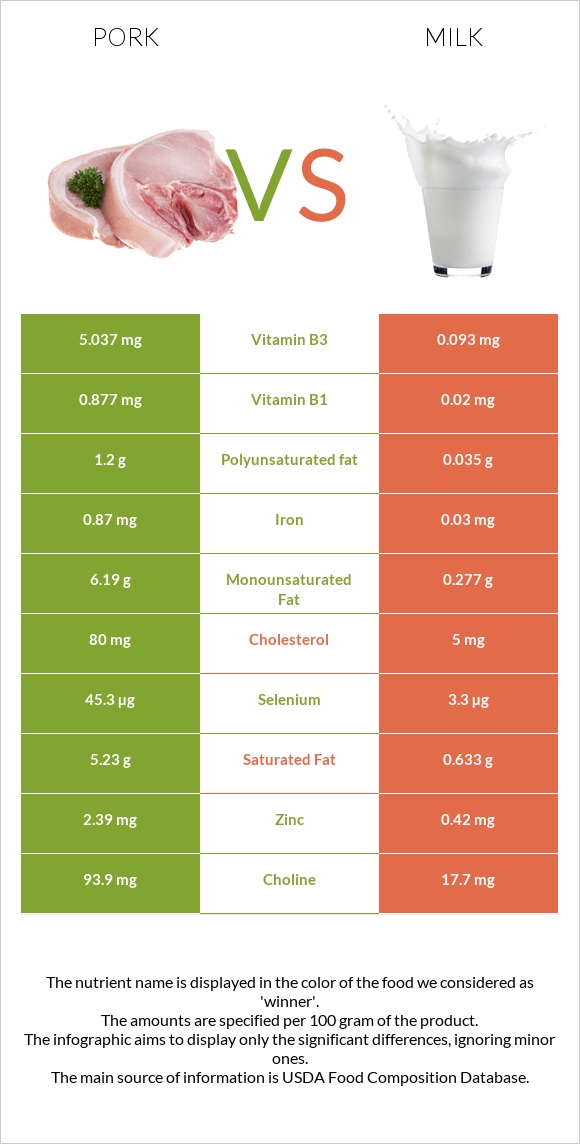
The main differences between pork and milk Pork has more selenium, vitamin B1, vitamin B6, vitamin B3, phosphorus, zinc, and choline; however, milk has more calcium. Daily need coverage for selenium for pork is 76% higher. Milk has 54 times less vitamin B3 than pork. Pork has 5.037mg of vitamin B3, while milk has 0.093mg. Milk is lower in cholesterol. Milk has a higher glycemic index than pork. Food types used in this article are Pork, fresh, loin, whole, separable lean, and fat, cooked, broiled and Milk, lowfat, fluid, 1% milkfat, with added vitamin A and vitamin D .
Infographic
Mineral Comparison
Mineral comparison score is based on the number of minerals by which one or the other food is richer. The "coverage" charts below show how much of the daily needs can be covered by 300 grams of the food.
8
100 g
300 g
3 oz - 85g 1 chop, excluding refuse (yield from 1 raw chop, with refuse, weighing 151 g) - 87g
Magnesium
Magnesium
Calcium
Calcium
Potassium
Potassium
Iron
Iron
Copper
Copper
Zinc
Zinc
Phosphorus
Phosphorus
Sodium
Sodium
Manganese
Manganese
Selenium
Selenium
20%
5.7%
37%
33%
24%
65%
105%
8.1%
1.2%
247%
2
100 g
300 g
1 fl oz - 30.5g 1 cup - 244g 1 quart - 976g
Magnesium
Magnesium
Calcium
Calcium
Potassium
Potassium
Iron
Iron
Copper
Copper
Zinc
Zinc
Phosphorus
Phosphorus
Sodium
Sodium
Manganese
Manganese
Selenium
Selenium
7.9%
38%
13%
1.1%
3.3%
11%
41%
5.7%
0.39%
18%
Vitamin Comparison
Vitamin comparison score is based on the number of vitamins by which one or the other food is richer. The "coverage" charts below show how much of the daily needs can be covered by 300 grams of the food.
8
100 g
300 g
3 oz - 85g 1 chop, excluding refuse (yield from 1 raw chop, with refuse, weighing 151 g) - 87g
Vitamin C
Vit. C
Vitamin D
Vit. D
Vitamin A
Vit. A
Vitamin E
Vit. E
Vitamin B1
Vit. B1
Vitamin B2
Vit. B2
Vitamin B3
Vit. B3
Vitamin B5
Vit. B5
Vitamin B6
Vit. B6
Vitamin B12
Vit. B12
Vitamin K
Vit. K
Folate
Folate
2%
20%
0.67%
5.8%
219%
74%
94%
42%
107%
88%
0%
3.8%
2
100 g
300 g
1 fl oz - 30.5g 1 cup - 244g 1 quart - 976g
Vitamin C
Vit. C
Vitamin D
Vit. D
Vitamin A
Vit. A
Vitamin E
Vit. E
Vitamin B1
Vit. B1
Vitamin B2
Vit. B2
Vitamin B3
Vit. B3
Vitamin B5
Vit. B5
Vitamin B6
Vit. B6
Vitamin B12
Vit. B12
Vitamin K
Vit. K
Folate
Folate
0%
18%
19%
0.2%
5%
43%
1.7%
22%
8.5%
59%
0.25%
3.8%
All nutrients comparison - raw data values
Nutrient
DV% diff.
Selenium
45.3µg
3.3µg
76%
Vitamin B1
0.877mg
0.02mg
71%
Protein
27.32g
3.37g
48%
Vitamin B6
0.464mg
0.037mg
33%
Vitamin B3
5.037mg
0.093mg
31%
Cholesterol
80mg
5mg
25%
Phosphorus
246mg
95mg
22%
Saturated fat
5.23g
0.633g
21%
Fats
13.92g
0.97g
20%
Zinc
2.39mg
0.42mg
18%
Monounsaturated fat
6.19g
0.277g
15%
Choline
93.9mg
17.7mg
14%
Calcium
19mg
125mg
11%
Iron
0.87mg
0.03mg
11%
Calories
242kcal
42kcal
10%
Vitamin B2
0.321mg
0.185mg
10%
Vitamin B12
0.7µg
0.47µg
10%
Potassium
423mg
150mg
8%
Polyunsaturated fat
1.2g
0.035g
8%
Copper
0.073mg
0.01mg
7%
Vitamin B5
0.698mg
0.361mg
7%
Vitamin A
2µg
58µg
6%
Magnesium
28mg
11mg
4%
Carbs
0g
4.99g
2%
Vitamin E
0.29mg
0.01mg
2%
Vitamin C
0.6mg
0mg
1%
Vitamin D*
53 IU
48 IU
1%
Vitamin D
1.3µg
1.2µg
1%
Sodium
62mg
44mg
1%
Protein per 100 calories
11g
8g
N/A
Calories per 10 g protein
89kcal
125kcal
N/A
Weight per 100 calories
41g
238g
N/A
Unsaturated / Saturated Fat ratio
1.4
0.49
N/A
Net carbs
0g
4.99g
N/A
Sugar
0g
5.2g
N/A
Manganese
0.009mg
0.003mg
0%
Vitamin K
0µg
0.1µg
0%
Folate
5µg
5µg
0%
Tryptophan
0.338mg
0.043mg
0%
Threonine
1.234mg
0.143mg
0%
Isoleucine
1.26mg
0.174mg
0%
Leucine
2.177mg
0.319mg
0%
Lysine
2.446mg
0.282mg
0%
Methionine
0.712mg
0.088mg
0%
Phenylalanine
1.086mg
0.174mg
0%
Valine
1.473mg
0.22mg
0%
Histidine
1.067mg
0.101mg
0%
Omega-3 - ALA
0.004g
N/A
Omega-6 - Linoleic acid
0.027g
N/A
Macronutrient Comparison
Macronutrient breakdown side-by-side comparison
3
27%
14%
58%
Protein:
27.32 g
Fats:
13.92 g
Carbs:
0 g
Water:
57.87 g
Other:
0.89 g
2
3%
5%
90%
Protein:
3.37 g
Fats:
0.97 g
Carbs:
4.99 g
Water:
89.92 g
Other:
0.75 g
Contains
more
Protein Protein
+710.7%
Contains
more
Fats Fats
+1335.1%
Contains
more
Other Other
+18.7%
Contains
more
Carbs Carbs
+∞%
Contains
more
Water Water
+55.4%
Fat Type Comparison
Fat type breakdown side-by-side comparison
2
41%
49%
10%
Saturated fat:
Sat. Fat
5.23 g
Monounsaturated fat:
Mono. Fat
6.19 g
Polyunsaturated fat:
Poly. Fat
1.2 g
1
67%
29%
4%
Saturated fat:
Sat. Fat
0.633 g
Monounsaturated fat:
Mono. Fat
0.277 g
Polyunsaturated fat:
Poly. Fat
0.035 g
Contains
more
Mono. Fat Monounsaturated fat
+2134.7%
Contains
more
Poly. Fat Polyunsaturated fat
+3328.6%
Contains
less
Sat. Fat Saturated fat
-87.9%