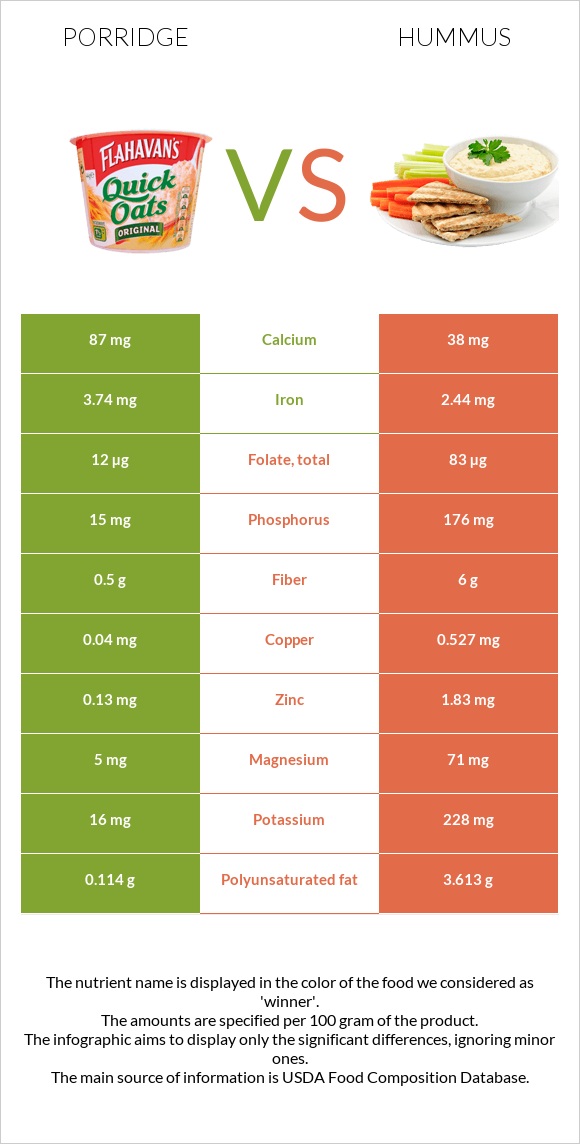
Differences between porridge and hummus Porridge has more iron, while hummus has more copper, manganese, phosphorus, fiber, folate, magnesium, zinc, and vitamin B6. Hummus's daily need coverage for copper is 54% higher. Hummus contains 2 times less iron than porridge. Porridge contains 3.74mg of iron, while hummus contains 2.44mg. The amount of sodium in porridge is lower. Hummus has a lower glycemic index. The glycemic index of hummus is 6, while the glycemic index of porridge is 66. The food types used in this comparison are Cereals, CREAM OF WHEAT, regular (10 minute), cooked with water, without salt and Hummus, commercial .
Infographic
Mineral Comparison
Mineral comparison score is based on the number of minerals by which one or the other food is richer. The "coverage" charts below show how much of the daily needs can be covered by 300 grams of the food.
3
100 g
300 g
1 tbsp - 16g 1 cup (1 serving) - 251g
Magnesium
Magnesium
Calcium
Calcium
Potassium
Potassium
Iron
Iron
Copper
Copper
Zinc
Zinc
Phosphorus
Phosphorus
Sodium
Sodium
Manganese
Manganese
Selenium
Selenium
3.6%
26%
1.4%
140%
13%
3.5%
6.4%
0.78%
0%
15%
6
100 g
300 g
1 tbsp - 15g 1 cup - 246g
Magnesium
Magnesium
Calcium
Calcium
Potassium
Potassium
Iron
Iron
Copper
Copper
Zinc
Zinc
Phosphorus
Phosphorus
Sodium
Sodium
Manganese
Manganese
Selenium
Selenium
51%
11%
20%
92%
176%
50%
75%
49%
101%
14%
Vitamin Comparison
Vitamin comparison score is based on the number of vitamins by which one or the other food is richer. The "coverage" charts below show how much of the daily needs can be covered by 300 grams of the food.
2
100 g
300 g
1 tbsp - 16g 1 cup (1 serving) - 251g
Vitamin C
Vit. C
Vitamin D
Vit. D
Vitamin A
Vit. A
Vitamin E
Vit. E
Vitamin B1
Vit. B1
Vitamin B2
Vit. B2
Vitamin B3
Vit. B3
Vitamin B5
Vit. B5
Vitamin B6
Vit. B6
Vitamin B12
Vit. B12
Vitamin K
Vit. K
Folate
Folate
0%
0%
0%
0.4%
14%
5.8%
9.8%
4.3%
3%
0%
0.25%
9%
6
100 g
300 g
1 tbsp - 15g 1 cup - 246g
Vitamin C
Vit. C
Vitamin D
Vit. D
Vitamin A
Vit. A
Vitamin E
Vit. E
Vitamin B1
Vit. B1
Vitamin B2
Vit. B2
Vitamin B3
Vit. B3
Vitamin B5
Vit. B5
Vitamin B6
Vit. B6
Vitamin B12
Vit. B12
Vitamin K
Vit. K
Folate
Folate
0%
0%
0%
0%
45%
15%
11%
7.9%
46%
0%
0%
62%
All nutrients comparison - raw data values
Nutrient
DV% diff.
Copper
0.04mg
0.527mg
54%
Manganese
0mg
0.773mg
34%
Phosphorus
15mg
176mg
23%
Polyunsaturated fat
0.114g
3.613g
23%
Fiber
0.5g
6g
22%
Folate
12µg
83µg
18%
Magnesium
5mg
71mg
16%
Iron
3.74mg
2.44mg
16%
Sodium
6mg
379mg
16%
Zinc
0.13mg
1.83mg
15%
Fats
0.21g
9.6g
14%
Vitamin B6
0.013mg
0.2mg
14%
Protein
1.44g
7.9g
13%
Vitamin B1
0.055mg
0.18mg
10%
Monounsaturated fat
0.028g
4.039g
10%
Calories
50kcal
166kcal
6%
Potassium
16mg
228mg
6%
Saturated fat
0.033g
1.437g
6%
Calcium
87mg
38mg
5%
Vitamin B2
0.025mg
0.064mg
3%
Carbs
10.52g
14.29g
1%
Vitamin B5
0.071mg
0.132mg
1%
Protein per 100 calories
2.9g
4.8g
N/A
Calories per 10 g protein
347kcal
210kcal
N/A
Weight per 100 calories
200g
60g
N/A
Unsaturated / Saturated Fat ratio
4.3
5.3
N/A
Net carbs
10.02g
8.29g
N/A
Sugar
0.03g
N/A
Vitamin E
0.02mg
0%
Selenium
2.8µg
2.6µg
0%
Vitamin B3
0.52mg
0.582mg
0%
Vitamin K
0.1µg
0%
Tryptophan
0.02mg
0%
Threonine
0.045mg
0%
Isoleucine
0.063mg
0%
Leucine
0.11mg
0%
Lysine
0.037mg
0%
Methionine
0.027mg
0%
Phenylalanine
0.078mg
0%
Valine
0.07mg
0%
Histidine
0.033mg
0%
Macronutrient Comparison
Macronutrient breakdown side-by-side comparison
1
11%
88%
Protein:
1.44 g
Fats:
0.21 g
Carbs:
10.52 g
Water:
87.61 g
Other:
0.22 g
4
8%
10%
14%
67%
Protein:
7.9 g
Fats:
9.6 g
Carbs:
14.29 g
Water:
66.59 g
Other:
1.62 g
Contains
more
Water Water
+31.6%
Contains
more
Protein Protein
+448.6%
Contains
more
Fats Fats
+4471.4%
Contains
more
Carbs Carbs
+35.8%
Contains
more
Other Other
+636.4%
Fat Type Comparison
Fat type breakdown side-by-side comparison
1
19%
16%
65%
Saturated fat:
Sat. Fat
0.033 g
Monounsaturated fat:
Mono. Fat
0.028 g
Polyunsaturated fat:
Poly. Fat
0.114 g
2
16%
44%
40%
Saturated fat:
Sat. Fat
1.437 g
Monounsaturated fat:
Mono. Fat
4.039 g
Polyunsaturated fat:
Poly. Fat
3.613 g
Contains
less
Sat. Fat Saturated fat
-97.7%
Contains
more
Mono. Fat Monounsaturated fat
+14325%
Contains
more
Poly. Fat Polyunsaturated fat
+3069.3%