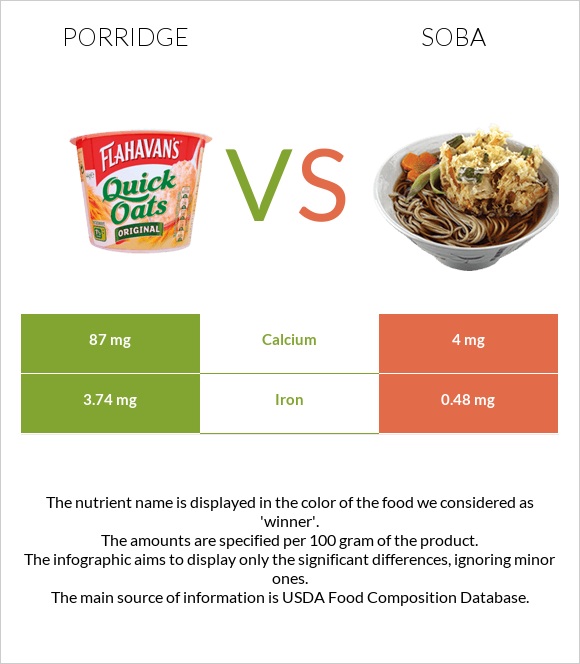
How are porridge and soba different? Porridge is richer in iron and calcium, while soba is higher in manganese. Porridge covers your daily need for iron, 41% more than soba. Porridge contains 22 times more calcium than soba. Porridge contains 87mg of calcium, while soba contains 4mg. Porridge has a higher glycemic index (66) than soba (46). Cereals, CREAM OF WHEAT, regular (10 minute), cooked with water, without salt and Noodles, japanese, soba, cooked types were used in this article.
Infographic
Mineral Comparison
Mineral comparison score is based on the number of minerals by which one or the other food is richer. The "coverage" charts below show how much of the daily needs can be covered by 300 grams of the food.
5
100 g
300 g
1 tbsp - 16g 1 cup (1 serving) - 251g
Magnesium
Magnesium
Calcium
Calcium
Potassium
Potassium
Iron
Iron
Copper
Copper
Zinc
Zinc
Phosphorus
Phosphorus
Sodium
Sodium
Manganese
Manganese
Selenium
Selenium
3.6%
26%
1.4%
140%
13%
3.5%
6.4%
0.78%
0%
15%
4
100 g
300 g
1 cup - 114g
Magnesium
Magnesium
Calcium
Calcium
Potassium
Potassium
Iron
Iron
Copper
Copper
Zinc
Zinc
Phosphorus
Phosphorus
Sodium
Sodium
Manganese
Manganese
Selenium
Selenium
6.4%
1.2%
3.1%
18%
2.7%
3.3%
11%
7.8%
49%
0%
Vitamin Comparison
Vitamin comparison score is based on the number of vitamins by which one or the other food is richer. The "coverage" charts below show how much of the daily needs can be covered by 300 grams of the food.
3
100 g
300 g
1 tbsp - 16g 1 cup (1 serving) - 251g
Vitamin C
Vit. C
Vitamin D
Vit. D
Vitamin A
Vit. A
Vitamin E
Vit. E
Vitamin B1
Vit. B1
Vitamin B2
Vit. B2
Vitamin B3
Vit. B3
Vitamin B5
Vit. B5
Vitamin B6
Vit. B6
Vitamin B12
Vit. B12
Vitamin K
Vit. K
Folate
Folate
0%
0%
0%
0.4%
14%
5.8%
9.8%
4.3%
3%
0%
0.25%
9%
3
100 g
300 g
1 cup - 114g
Vitamin C
Vit. C
Vitamin D
Vit. D
Vitamin A
Vit. A
Vitamin E
Vit. E
Vitamin B1
Vit. B1
Vitamin B2
Vit. B2
Vitamin B3
Vit. B3
Vitamin B5
Vit. B5
Vitamin B6
Vit. B6
Vitamin B12
Vit. B12
Vitamin K
Vit. K
Folate
Folate
0%
0%
0%
0%
24%
6%
9.6%
14%
9.2%
0%
0%
5.3%
All nutrients comparison - raw data values
Nutrient
DV% diff.
Iron
3.74mg
0.48mg
41%
Manganese
0mg
0.374mg
16%
Calcium
87mg
4mg
8%
Protein
1.44g
5.06g
7%
Selenium
2.8µg
5%
Carbs
10.52g
21.44g
4%
Copper
0.04mg
0.008mg
4%
Vitamin B1
0.055mg
0.094mg
3%
Vitamin B5
0.071mg
0.235mg
3%
Calories
50kcal
99kcal
2%
Fiber
0.5g
2%
Sodium
6mg
60mg
2%
Vitamin B6
0.013mg
0.04mg
2%
Magnesium
5mg
9mg
1%
Potassium
16mg
35mg
1%
Phosphorus
15mg
25mg
1%
Folate
12µg
7µg
1%
Polyunsaturated fat
0.114g
0.031g
1%
Protein per 100 calories
2.9g
5.1g
N/A
Calories per 10 g protein
347kcal
196kcal
N/A
Weight per 100 calories
200g
101g
N/A
Fats
0.21g
0.1g
0%
Net carbs
10.02g
21.44g
N/A
Sugar
0.03g
N/A
Zinc
0.13mg
0.12mg
0%
Vitamin E
0.02mg
0%
Vitamin B2
0.025mg
0.026mg
0%
Vitamin B3
0.52mg
0.51mg
0%
Vitamin K
0.1µg
0%
Saturated fat
0.033g
0.019g
0%
Monounsaturated fat
0.028g
0.026g
0%
Tryptophan
0.02mg
0.072mg
0%
Threonine
0.045mg
0.177mg
0%
Isoleucine
0.063mg
0.195mg
0%
Leucine
0.11mg
0.33mg
0%
Lysine
0.037mg
0.214mg
0%
Methionine
0.027mg
0.072mg
0%
Phenylalanine
0.078mg
0.217mg
0%
Valine
0.07mg
0.249mg
0%
Histidine
0.033mg
0.119mg
0%
Macronutrient Comparison
Macronutrient breakdown side-by-side comparison
2
11%
88%
Protein:
1.44 g
Fats:
0.21 g
Carbs:
10.52 g
Water:
87.61 g
Other:
0.22 g
3
5%
21%
73%
Protein:
5.06 g
Fats:
0.1 g
Carbs:
21.44 g
Water:
73.01 g
Other:
0.39 g
Contains
more
Fats Fats
+110%
Contains
more
Water Water
+20%
Contains
more
Protein Protein
+251.4%
Contains
more
Carbs Carbs
+103.8%
Contains
more
Other Other
+77.3%
Fat Type Comparison
Fat type breakdown side-by-side comparison
2
19%
16%
65%
Saturated fat:
Sat. Fat
0.033 g
Monounsaturated fat:
Mono. Fat
0.028 g
Polyunsaturated fat:
Poly. Fat
0.114 g
1
25%
34%
41%
Saturated fat:
Sat. Fat
0.019 g
Monounsaturated fat:
Mono. Fat
0.026 g
Polyunsaturated fat:
Poly. Fat
0.031 g
Contains
more
Poly. Fat Polyunsaturated fat
+267.7%
Contains
less
Sat. Fat Saturated fat
-42.4%
~equal in
Monounsaturated fat
~0.026g