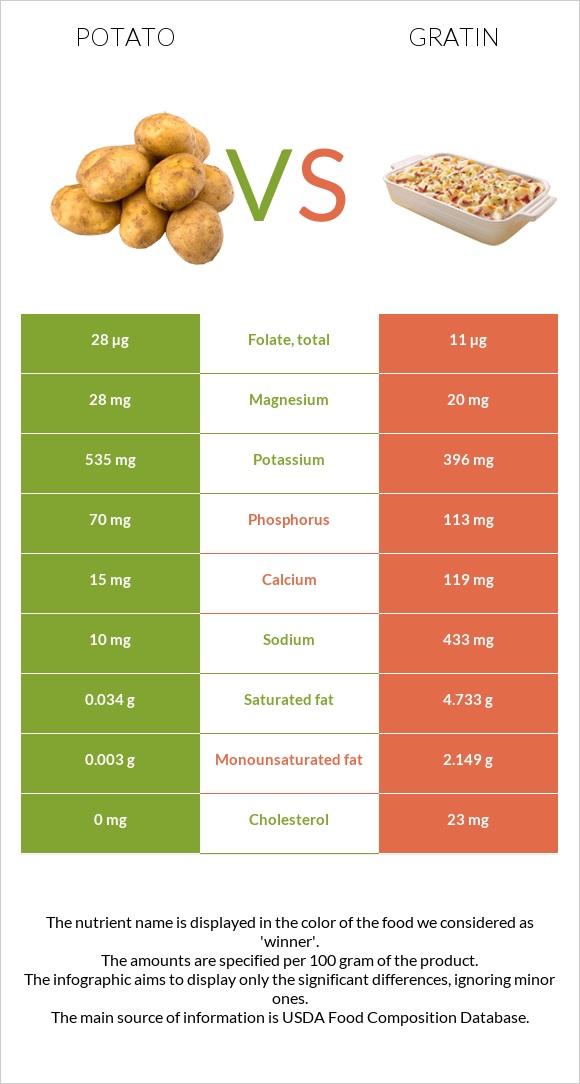
What are the differences between potatoes and gratin? Potatoes are higher in vitamin B6 and iron, yet gratin is higher in calcium, phosphorus, vitamin B2, and vitamin A. Gratin's daily need coverage for saturated fat is 23% more. Potatoes have 3 times more folate than gratin. While potatoes have 28µg of folate, gratin has only 11µg. The amount of sodium in potatoes is lower. We used Potatoes, baked, flesh, and skin, without salt and Potatoes, au gratin, home-prepared from recipe using butter types in this article.
Infographic
Mineral Comparison
Mineral comparison score is based on the number of minerals by which one or the other food is richer. The "coverage" charts below show how much of the daily needs can be covered by 300 grams of the food.
5
100 g
300 g
1 potato small - 138g 1 NLEA serving - 148g 1 potato medium - 173g 1 potato large - 299g
Magnesium
Magnesium
Calcium
Calcium
Potassium
Potassium
Iron
Iron
Copper
Copper
Zinc
Zinc
Phosphorus
Phosphorus
Sodium
Sodium
Manganese
Manganese
Selenium
Selenium
20%
4.5%
47%
41%
39%
9.8%
30%
1.3%
29%
2.2%
5
100 g
300 g
1 cup - 245g
Magnesium
Magnesium
Calcium
Calcium
Potassium
Potassium
Iron
Iron
Copper
Copper
Zinc
Zinc
Phosphorus
Phosphorus
Sodium
Sodium
Manganese
Manganese
Selenium
Selenium
14%
36%
35%
24%
53%
19%
48%
56%
21%
15%
Vitamin Comparison
Vitamin comparison score is based on the number of vitamins by which one or the other food is richer. The "coverage" charts below show how much of the daily needs can be covered by 300 grams of the food.
5
100 g
300 g
1 potato small - 138g 1 NLEA serving - 148g 1 potato medium - 173g 1 potato large - 299g
Vitamin C
Vit. C
Vitamin D
Vit. D
Vitamin A
Vit. A
Vitamin E
Vit. E
Vitamin B1
Vit. B1
Vitamin B2
Vit. B2
Vitamin B3
Vit. B3
Vitamin B5
Vit. B5
Vitamin B6
Vit. B6
Vitamin B12
Vit. B12
Vitamin K
Vit. K
Folate
Folate
32%
0%
0.33%
0.8%
16%
11%
26%
23%
72%
0%
5%
21%
2
100 g
300 g
1 cup - 245g
Vitamin C
Vit. C
Vitamin D
Vit. D
Vitamin A
Vit. A
Vitamin E
Vit. E
Vitamin B1
Vit. B1
Vitamin B2
Vit. B2
Vitamin B3
Vit. B3
Vitamin B5
Vit. B5
Vitamin B6
Vit. B6
Vitamin B12
Vit. B12
Vitamin K
Vit. K
Folate
Folate
33%
0%
21%
0%
16%
27%
19%
23%
40%
0%
0%
8.3%
All nutrients comparison - raw data values
Nutrient
DV% diff.
Saturated fat
0.034g
4.733g
21%
Sodium
10mg
433mg
18%
Fats
0.13g
7.59g
11%
Vitamin B6
0.311mg
0.174mg
11%
Calcium
15mg
119mg
10%
Cholesterol
0mg
23mg
8%
Starch
17.27g
7%
Vitamin A
1µg
64µg
7%
Iron
1.08mg
0.64mg
6%
Phosphorus
70mg
113mg
6%
Protein
2.5g
5.06g
5%
Copper
0.118mg
0.16mg
5%
Vitamin B2
0.048mg
0.116mg
5%
Monounsaturated fat
0.003g
2.149g
5%
Potassium
535mg
396mg
4%
Selenium
0.4µg
2.7µg
4%
Folate
28µg
11µg
4%
Carbs
21.15g
11.27g
3%
Zinc
0.36mg
0.69mg
3%
Manganese
0.219mg
0.161mg
3%
Vitamin B3
1.41mg
0.993mg
3%
Choline
14.8mg
3%
Calories
93kcal
132kcal
2%
Magnesium
28mg
20mg
2%
Fiber
2.2g
1.8g
2%
Vitamin K
2µg
2%
Polyunsaturated fat
0.057g
0.276g
1%
Protein per 100 calories
2.7g
3.8g
N/A
Calories per 10 g protein
372kcal
261kcal
N/A
Weight per 100 calories
108g
76g
N/A
Unsaturated / Saturated Fat ratio
1.8
0.51
N/A
Vitamin C
9.6mg
9.9mg
0%
Net carbs
18.95g
9.47g
N/A
Sugar
1.18g
N/A
Vitamin E
0.04mg
0%
Vitamin B1
0.064mg
0.064mg
0%
Vitamin B5
0.376mg
0.387mg
0%
Tryptophan
0.025mg
0.07mg
0%
Threonine
0.081mg
0.192mg
0%
Isoleucine
0.08mg
0.284mg
0%
Leucine
0.119mg
0.443mg
0%
Lysine
0.13mg
0.381mg
0%
Methionine
0.038mg
0.117mg
0%
Phenylalanine
0.099mg
0.254mg
0%
Valine
0.125mg
0.325mg
0%
Histidine
0.042mg
0.151mg
0%
Fructose
0.34g
0%
Macronutrient Comparison
Macronutrient breakdown side-by-side comparison
2
3%
21%
75%
Protein:
2.5 g
Fats:
0.13 g
Carbs:
21.15 g
Water:
74.89 g
Other:
1.33 g
3
5%
8%
11%
74%
2%
Protein:
5.06 g
Fats:
7.59 g
Carbs:
11.27 g
Water:
74 g
Other:
2.08 g
Contains
more
Carbs Carbs
+87.7%
Contains
more
Protein Protein
+102.4%
Contains
more
Fats Fats
+5738.5%
Contains
more
Other Other
+56.4%
Fat Type Comparison
Fat type breakdown side-by-side comparison
1
36%
3%
61%
Saturated fat:
Sat. Fat
0.034 g
Monounsaturated fat:
Mono. Fat
0.003 g
Polyunsaturated fat:
Poly. Fat
0.057 g
2
66%
30%
4%
Saturated fat:
Sat. Fat
4.733 g
Monounsaturated fat:
Mono. Fat
2.149 g
Polyunsaturated fat:
Poly. Fat
0.276 g
Contains
less
Sat. Fat Saturated fat
-99.3%
Contains
more
Mono. Fat Monounsaturated fat
+71533.3%
Contains
more
Poly. Fat Polyunsaturated fat
+384.2%