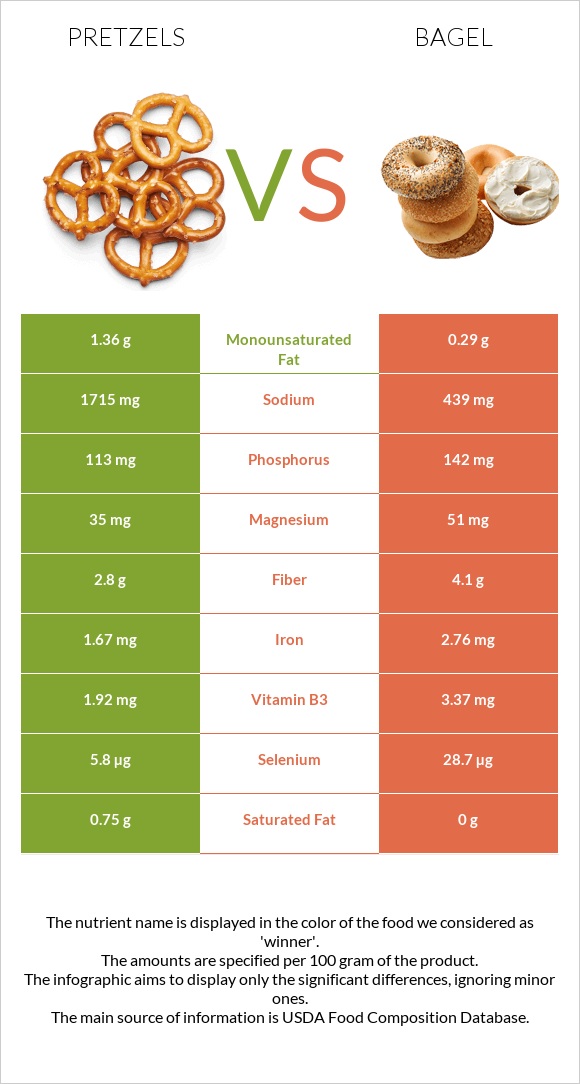
Significant differences between pretzels and bagel Pretzels have more manganese and copper; however, bagel is richer in selenium, vitamin B1, iron, vitamin B3, vitamin B2, and fiber. Pretzels cover your daily sodium needs 55% more than bagel. Bagel has 2 times less copper than pretzels. Pretzels have 0.264mg of copper, while bagel has 0.175mg. Bagel contains less sodium. Pretzels have a higher glycemic index. The glycemic index of pretzels is 83, while the glycemic index of bagel is 69. Specific food types used in this comparison are Snacks, pretzels, hard, plain, made with unenriched flour, salted and Bagels, wheat .
Infographic
Mineral Comparison
Mineral comparison score is based on the number of minerals by which one or the other food is richer. The "coverage" charts below show how much of the daily needs can be covered by 300 grams of the food.
3
100 g
300 g
1 oz - 28.35g 10 twists - 60g
Magnesium
Magnesium
Calcium
Calcium
Potassium
Potassium
Iron
Iron
Copper
Copper
Zinc
Zinc
Phosphorus
Phosphorus
Sodium
Sodium
Manganese
Manganese
Selenium
Selenium
25%
11%
13%
63%
88%
23%
48%
224%
233%
32%
7
100 g
300 g
1 bagel - 98g
Magnesium
Magnesium
Calcium
Calcium
Potassium
Potassium
Iron
Iron
Copper
Copper
Zinc
Zinc
Phosphorus
Phosphorus
Sodium
Sodium
Manganese
Manganese
Selenium
Selenium
36%
6%
15%
104%
58%
30%
61%
57%
187%
157%
Vitamin Comparison
Vitamin comparison score is based on the number of vitamins by which one or the other food is richer. The "coverage" charts below show how much of the daily needs can be covered by 300 grams of the food.
0
100 g
300 g
1 oz - 28.35g 10 twists - 60g
Vitamin C
Vit. C
Vitamin D
Vit. D
Vitamin A
Vit. A
Vitamin E
Vit. E
Vitamin B1
Vit. B1
Vitamin B2
Vit. B2
Vitamin B3
Vit. B3
Vitamin B5
Vit. B5
Vitamin B6
Vit. B6
Vitamin B12
Vit. B12
Vitamin K
Vit. K
Folate
Folate
0%
0%
0%
0%
45%
23%
36%
17%
27%
0%
0%
62%
7
100 g
300 g
1 bagel - 98g
Vitamin C
Vit. C
Vitamin D
Vit. D
Vitamin A
Vit. A
Vitamin E
Vit. E
Vitamin B1
Vit. B1
Vitamin B2
Vit. B2
Vitamin B3
Vit. B3
Vitamin B5
Vit. B5
Vitamin B6
Vit. B6
Vitamin B12
Vit. B12
Vitamin K
Vit. K
Folate
Folate
0%
0%
0%
6.4%
101%
48%
63%
23%
34%
0%
3.8%
57%
All nutrients comparison - raw data values
Nutrient
DV% diff.
Sodium
1715mg
439mg
55%
Selenium
5.8µg
28.7µg
42%
Vitamin B1
0.18mg
0.403mg
19%
Manganese
1.789mg
1.43mg
16%
Iron
1.67mg
2.76mg
14%
Carbs
79.2g
48.89g
10%
Copper
0.264mg
0.175mg
10%
Vitamin B3
1.92mg
3.37mg
9%
Vitamin B2
0.1mg
0.209mg
8%
Calories
381kcal
250kcal
7%
Fiber
2.8g
4.1g
5%
Magnesium
35mg
51mg
4%
Phosphorus
113mg
142mg
4%
Fats
3.5g
1.53g
3%
Saturated fat
0.75g
0g
3%
Monounsaturated fat
1.36g
0.29g
3%
Protein
9.1g
10.2g
2%
Calcium
36mg
20mg
2%
Zinc
0.85mg
1.1mg
2%
Vitamin E
0.32mg
2%
Vitamin B5
0.288mg
0.375mg
2%
Vitamin B6
0.116mg
0.147mg
2%
Folate
83µg
76µg
2%
Choline
9.8mg
2%
Polyunsaturated fat
1.22g
0.936g
2%
Potassium
146mg
165mg
1%
Vitamin K
1.5µg
1%
Protein per 100 calories
2.4g
4.1g
N/A
Calories per 10 g protein
419kcal
245kcal
N/A
Weight per 100 calories
26g
40g
N/A
Unsaturated / Saturated Fat ratio
3.4
N/A
Net carbs
76.4g
44.79g
N/A
Sugar
6.12g
N/A
Tryptophan
0.109mg
0%
Threonine
0.259mg
0%
Isoleucine
0.345mg
0%
Leucine
0.636mg
0%
Lysine
0.221mg
0%
Methionine
0.164mg
0%
Phenylalanine
0.453mg
0%
Valine
0.392mg
0%
Histidine
0.201mg
0%
Macronutrient Comparison
Macronutrient breakdown side-by-side comparison
3
9%
4%
79%
3%
5%
Protein:
9.1 g
Fats:
3.5 g
Carbs:
79.2 g
Water:
3.3 g
Other:
4.9 g
2
10%
49%
38%
2%
Protein:
10.2 g
Fats:
1.53 g
Carbs:
48.89 g
Water:
37.55 g
Other:
1.83 g
Contains
more
Fats Fats
+128.8%
Contains
more
Carbs Carbs
+62%
Contains
more
Other Other
+167.8%
Contains
more
Protein Protein
+12.1%
Contains
more
Water Water
+1037.9%
Fat Type Comparison
Fat type breakdown side-by-side comparison
2
23%
41%
37%
Saturated fat:
Sat. Fat
0.75 g
Monounsaturated fat:
Mono. Fat
1.36 g
Polyunsaturated fat:
Poly. Fat
1.22 g
1
24%
76%
Saturated fat:
Sat. Fat
0 g
Monounsaturated fat:
Mono. Fat
0.29 g
Polyunsaturated fat:
Poly. Fat
0.936 g
Contains
more
Mono. Fat Monounsaturated fat
+369%
Contains
more
Poly. Fat Polyunsaturated fat
+30.3%
Contains
less
Sat. Fat Saturated fat
-100%