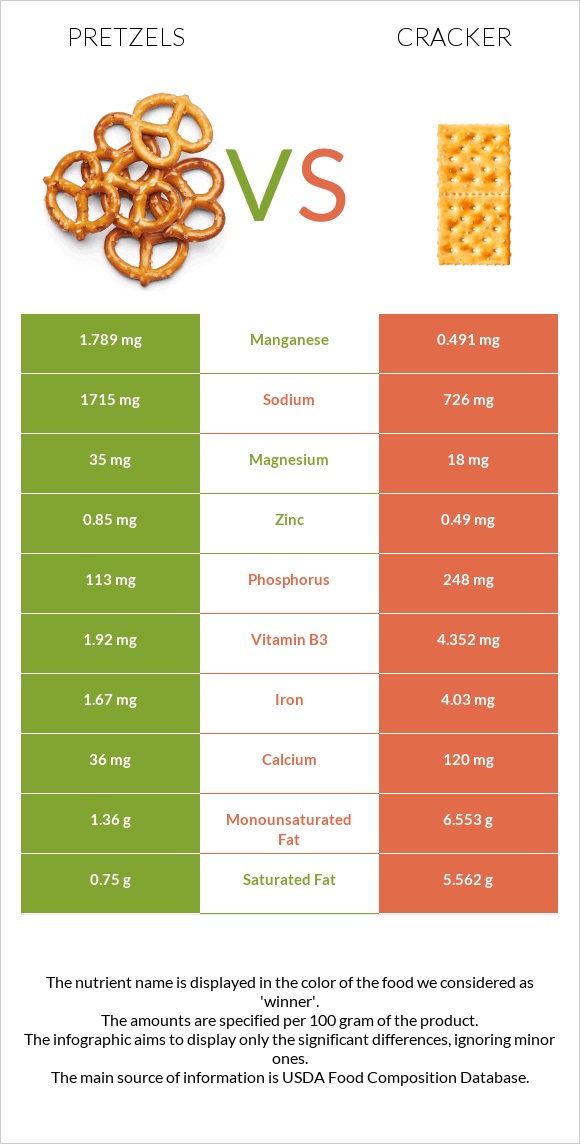
Differences between pretzels and crackers Pretzels have more manganese and copper, while crackers have more iron, vitamin B2, vitamin B1, phosphorus, vitamin B3, and calcium. Pretzels' daily need coverage for manganese is 56% higher. Crackers contain 3 times less copper than pretzels. Pretzels contain 0.264mg of copper, while crackers contain 0.104mg. The amount of sodium in crackers is lower. Crackers have a lower glycemic index. The glycemic index of crackers is 63, while the glycemic index of pretzels is 83. The food types used in this comparison are Snacks, pretzels, hard, plain, made with unenriched flour, salted and Crackers, standard snack-type, regular .
Infographic
Mineral Comparison
Mineral comparison score is based on the number of minerals by which one or the other food is richer. The "coverage" charts below show how much of the daily needs can be covered by 300 grams of the food.
5
100 g
300 g
1 oz - 28.35g 10 twists - 60g
Magnesium
Magnesium
Calcium
Calcium
Potassium
Potassium
Iron
Iron
Copper
Copper
Zinc
Zinc
Phosphorus
Phosphorus
Sodium
Sodium
Manganese
Manganese
Selenium
Selenium
25%
11%
13%
63%
88%
23%
48%
224%
233%
32%
5
100 g
300 g
1 cracker, round - 3.2g 1 cracker, rectangular - 4g 5 crackers - 16g 5 crackers, regular size, round (1 serving) - 16g 1 cup crushed - 52g
Magnesium
Magnesium
Calcium
Calcium
Potassium
Potassium
Iron
Iron
Copper
Copper
Zinc
Zinc
Phosphorus
Phosphorus
Sodium
Sodium
Manganese
Manganese
Selenium
Selenium
13%
36%
10%
151%
35%
13%
106%
95%
64%
37%
Vitamin Comparison
Vitamin comparison score is based on the number of vitamins by which one or the other food is richer. The "coverage" charts below show how much of the daily needs can be covered by 300 grams of the food.
1
100 g
300 g
1 oz - 28.35g 10 twists - 60g
Vitamin C
Vit. C
Vitamin D
Vit. D
Vitamin A
Vit. A
Vitamin E
Vit. E
Vitamin B1
Vit. B1
Vitamin B2
Vit. B2
Vitamin B3
Vit. B3
Vitamin B5
Vit. B5
Vitamin B6
Vit. B6
Vitamin B12
Vit. B12
Vitamin K
Vit. K
Folate
Folate
0%
0%
0%
0%
45%
23%
36%
17%
27%
0%
0%
62%
7
100 g
300 g
1 cracker, round - 3.2g 1 cracker, rectangular - 4g 5 crackers - 16g 5 crackers, regular size, round (1 serving) - 16g 1 cup crushed - 52g
Vitamin C
Vit. C
Vitamin D
Vit. D
Vitamin A
Vit. A
Vitamin E
Vit. E
Vitamin B1
Vit. B1
Vitamin B2
Vit. B2
Vitamin B3
Vit. B3
Vitamin B5
Vit. B5
Vitamin B6
Vit. B6
Vitamin B12
Vit. B12
Vitamin K
Vit. K
Folate
Folate
0%
0%
0%
61%
104%
105%
82%
25%
15%
0%
173%
69%
All nutrients comparison - raw data values
Nutrient
DV% diff.
Polyunsaturated fat
1.22g
13.137g
79%
Vitamin K
69.3µg
58%
Manganese
1.789mg
0.491mg
56%
Sodium
1715mg
726mg
43%
Fats
3.5g
26.43g
35%
Iron
1.67mg
4.03mg
30%
Vitamin B2
0.1mg
0.456mg
27%
Saturated fat
0.75g
5.562g
22%
Starch
49.69g
20%
Vitamin E
3.03mg
20%
Vitamin B1
0.18mg
0.416mg
20%
Phosphorus
113mg
248mg
19%
Copper
0.264mg
0.104mg
18%
Vitamin B3
1.92mg
4.352mg
15%
Monounsaturated fat
1.36g
6.553g
13%
Calcium
36mg
120mg
8%
Calories
381kcal
510kcal
6%
Carbs
79.2g
61.3g
6%
Protein
9.1g
6.64g
5%
Magnesium
35mg
18mg
4%
Vitamin B6
0.116mg
0.063mg
4%
Zinc
0.85mg
0.49mg
3%
Vitamin B5
0.288mg
0.417mg
3%
Fiber
2.8g
2.3g
2%
Selenium
5.8µg
6.7µg
2%
Folate
83µg
92µg
2%
Choline
9.6mg
2%
Potassium
146mg
118mg
1%
Protein per 100 calories
2.4g
1.3g
N/A
Calories per 10 g protein
419kcal
768kcal
N/A
Weight per 100 calories
26g
20g
N/A
Unsaturated / Saturated Fat ratio
3.4
3.5
N/A
Net carbs
76.4g
59g
N/A
Sugar
8.18g
N/A
Trans fat
1.076g
N/A
Tryptophan
0.109mg
0.084mg
0%
Threonine
0.259mg
0.193mg
0%
Isoleucine
0.345mg
0.246mg
0%
Leucine
0.636mg
0.471mg
0%
Lysine
0.221mg
0.103mg
0%
Methionine
0.164mg
0.112mg
0%
Phenylalanine
0.453mg
0.331mg
0%
Valine
0.392mg
0.294mg
0%
Histidine
0.201mg
0.145mg
0%
Fructose
0.29g
0%
Omega-3 - ALA
1.485g
N/A
Omega-6 - Gamma-linoleic acid
0.062g
N/A
Omega-6 - Eicosadienoic acid
0.009g
N/A
Omega-6 - Linoleic acid
11.48g
N/A
Macronutrient Comparison
Macronutrient breakdown side-by-side comparison
4
9%
4%
79%
3%
5%
Protein:
9.1 g
Fats:
3.5 g
Carbs:
79.2 g
Water:
3.3 g
Other:
4.9 g
1
7%
26%
61%
3%
2%
Protein:
6.64 g
Fats:
26.43 g
Carbs:
61.3 g
Water:
3.14 g
Other:
2.49 g
Contains
more
Protein Protein
+37%
Contains
more
Carbs Carbs
+29.2%
Contains
more
Other Other
+96.8%
Contains
more
Fats Fats
+655.1%
Fat Type Comparison
Fat type breakdown side-by-side comparison
1
23%
41%
37%
Saturated fat:
Sat. Fat
0.75 g
Monounsaturated fat:
Mono. Fat
1.36 g
Polyunsaturated fat:
Poly. Fat
1.22 g
2
22%
26%
52%
Saturated fat:
Sat. Fat
5.562 g
Monounsaturated fat:
Mono. Fat
6.553 g
Polyunsaturated fat:
Poly. Fat
13.137 g
Contains
less
Sat. Fat Saturated fat
-86.5%
Contains
more
Mono. Fat Monounsaturated fat
+381.8%
Contains
more
Poly. Fat Polyunsaturated fat
+976.8%