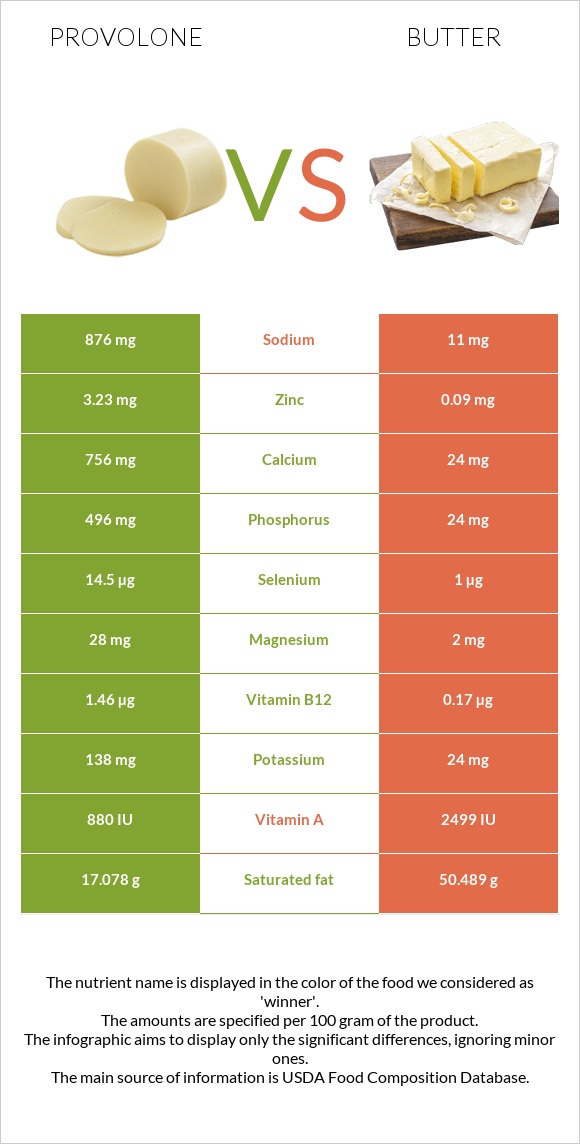
Significant differences between provolone and butter Provolone has more calcium, phosphorus, vitamin B12, zinc, selenium, and vitamin B2; however, butter is richer in vitamin A. Butter covers your daily saturated fat needs 167% more than provolone. Butter has 80 times less sodium than provolone. Provolone has 876mg of sodium, while butter has 11mg. Provolone has a higher glycemic index. The glycemic index of provolone is 27, while the glycemic index of butter is 0. Specific food types used in this comparison are Cheese, provolone and Butter, without salt .
Infographic
Mineral Comparison
Mineral comparison score is based on the number of minerals by which one or the other food is richer. The "coverage" charts below show how much of the daily needs can be covered by 300 grams of the food.
9
100 g
300 g
1 cubic inch - 17g 1 slice (1 oz) - 28g 1 oz - 28.35g 1 cup, diced - 132g 1 package (6 oz) - 170g
Magnesium
Magnesium
Calcium
Calcium
Potassium
Potassium
Iron
Iron
Copper
Copper
Zinc
Zinc
Phosphorus
Phosphorus
Sodium
Sodium
Manganese
Manganese
Selenium
Selenium
20%
227%
12%
20%
8.7%
88%
213%
114%
1.3%
79%
1
100 g
300 g
1 pat (1" sq, 1/3" high) - 5g 1 tbsp - 14.2g 1 stick - 113g 1 cup - 227g
Magnesium
Magnesium
Calcium
Calcium
Potassium
Potassium
Iron
Iron
Copper
Copper
Zinc
Zinc
Phosphorus
Phosphorus
Sodium
Sodium
Manganese
Manganese
Selenium
Selenium
1.4%
7.2%
2.1%
0.75%
5.3%
2.5%
10%
1.4%
0.52%
5.5%
Vitamin Comparison
Vitamin comparison score is based on the number of vitamins by which one or the other food is richer. The "coverage" charts below show how much of the daily needs can be covered by 300 grams of the food.
8
100 g
300 g
1 cubic inch - 17g 1 slice (1 oz) - 28g 1 oz - 28.35g 1 cup, diced - 132g 1 package (6 oz) - 170g
Vitamin C
Vit. C
Vitamin D
Vit. D
Vitamin A
Vit. A
Vitamin E
Vit. E
Vitamin B1
Vit. B1
Vitamin B2
Vit. B2
Vitamin B3
Vit. B3
Vitamin B5
Vit. B5
Vitamin B6
Vit. B6
Vitamin B12
Vit. B12
Vitamin K
Vit. K
Folate
Folate
0%
7.5%
79%
4.6%
4.8%
74%
2.9%
29%
17%
183%
5.5%
7.5%
3
100 g
300 g
1 pat (1" sq, 1/3" high) - 5g 1 tbsp - 14.2g 1 stick - 113g 1 cup - 227g
Vitamin C
Vit. C
Vitamin D
Vit. D
Vitamin A
Vit. A
Vitamin E
Vit. E
Vitamin B1
Vit. B1
Vitamin B2
Vit. B2
Vitamin B3
Vit. B3
Vitamin B5
Vit. B5
Vitamin B6
Vit. B6
Vitamin B12
Vit. B12
Vitamin K
Vit. K
Folate
Folate
0%
0%
228%
46%
1.3%
7.8%
0.79%
6.6%
0.69%
21%
18%
2.3%
All nutrients comparison - raw data values
Nutrient
DV% diff.
Saturated fat
17.078g
50.489g
152%
Fats
26.62g
81.11g
84%
Calcium
756mg
24mg
73%
Phosphorus
496mg
24mg
67%
Vitamin B12
1.46µg
0.17µg
54%
Vitamin A
236µg
684µg
50%
Protein
25.58g
0.85g
49%
Cholesterol
69mg
215mg
49%
Monounsaturated fat
7.393g
23.43g
40%
Sodium
876mg
11mg
38%
Zinc
3.23mg
0.09mg
29%
Selenium
14.5µg
1µg
25%
Vitamin B2
0.321mg
0.034mg
22%
Calories
351kcal
717kcal
18%
Polyunsaturated fat
0.769g
3.01g
15%
Vitamin E
0.23mg
2.32mg
14%
Vitamin B5
0.476mg
0.11mg
7%
Magnesium
28mg
2mg
6%
Iron
0.52mg
0.02mg
6%
Vitamin B6
0.073mg
0.003mg
5%
Vitamin K
2.2µg
7µg
4%
Vitamin D*
20 IU
0 IU
3%
Vitamin D
0.5µg
0µg
3%
Potassium
138mg
24mg
3%
Folate
10µg
3µg
2%
Carbs
2.14g
0.06g
1%
Copper
0.026mg
0.016mg
1%
Vitamin B1
0.019mg
0.005mg
1%
Vitamin B3
0.156mg
0.042mg
1%
Choline
15.4mg
18.8mg
1%
Protein per 100 calories
7.3g
0.12g
N/A
Calories per 10 g protein
137kcal
8435kcal
N/A
Weight per 100 calories
28g
14g
N/A
Unsaturated / Saturated Fat ratio
0.48
0.52
N/A
Net carbs
2.14g
0.06g
N/A
Sugar
0.56g
0.06g
N/A
Manganese
0.01mg
0.004mg
0%
Tryptophan
0.345mg
0.012mg
0%
Threonine
0.982mg
0.038mg
0%
Isoleucine
1.091mg
0.051mg
0%
Leucine
2.297mg
0.083mg
0%
Lysine
2.646mg
0.067mg
0%
Methionine
0.686mg
0.021mg
0%
Phenylalanine
1.287mg
0.041mg
0%
Valine
1.64mg
0.057mg
0%
Histidine
1.115mg
0.023mg
0%
Omega-3 - ALA
0.315g
N/A
Omega-6 - Linoleic acid
2.166g
N/A
Macronutrient Comparison
Macronutrient breakdown side-by-side comparison
4
26%
27%
2%
41%
5%
Protein:
25.58 g
Fats:
26.62 g
Carbs:
2.14 g
Water:
40.95 g
Other:
4.71 g
1
81%
18%
Protein:
0.85 g
Fats:
81.11 g
Carbs:
0.06 g
Water:
17.94 g
Other:
0.04 g
Contains
more
Protein Protein
+2909.4%
Contains
more
Carbs Carbs
+3466.7%
Contains
more
Water Water
+128.3%
Contains
more
Other Other
+11675%
Contains
more
Fats Fats
+204.7%
Fat Type Comparison
Fat type breakdown side-by-side comparison
1
68%
29%
3%
Saturated fat:
Sat. Fat
17.078 g
Monounsaturated fat:
Mono. Fat
7.393 g
Polyunsaturated fat:
Poly. Fat
0.769 g
2
66%
30%
4%
Saturated fat:
Sat. Fat
50.489 g
Monounsaturated fat:
Mono. Fat
23.43 g
Polyunsaturated fat:
Poly. Fat
3.01 g
Contains
less
Sat. Fat Saturated fat
-66.2%
Contains
more
Mono. Fat Monounsaturated fat
+216.9%
Contains
more
Poly. Fat Polyunsaturated fat
+291.4%