What are the differences between quince and nectarine? Quince is higher in vitamin C and iron, yet nectarine is higher in vitamin A and vitamin B3. Quince's daily need coverage for vitamin C is 11% more. Quince has 3 times more iron than nectarine. While quince has 0.7mg of iron, nectarine has only 0.28mg. We used Quinces, raw and Nectarines, raw types in this article.
Infographic
Mineral Comparison
Mineral comparison score is based on the number of minerals by which one or the other food is richer. The "coverage" charts below show how much of the daily needs can be covered by 300 grams of the food.
4
100 g
300 g
1 fruit without refuse - 92g
Magnesium
Magnesium
Calcium
Calcium
Potassium
Potassium
Iron
Iron
Copper
Copper
Zinc
Zinc
Phosphorus
Phosphorus
Sodium
Sodium
Manganese
Manganese
Selenium
Selenium
5.7%
3.3%
17%
26%
43%
1.1%
7.3%
0.52%
0%
3.3%
5
100 g
300 g
1 small (2-1/3" dia) - 129g 1 NLEA serving - 140g 1 medium (2-1/2" dia) - 142g 1 cup slices - 143g 1 large (2-3/4" dia) - 156g
Magnesium
Magnesium
Calcium
Calcium
Potassium
Potassium
Iron
Iron
Copper
Copper
Zinc
Zinc
Phosphorus
Phosphorus
Sodium
Sodium
Manganese
Manganese
Selenium
Selenium
6.4%
1.8%
18%
11%
29%
4.6%
11%
0%
7%
0%
Vitamin Comparison
Vitamin comparison score is based on the number of vitamins by which one or the other food is richer. The "coverage" charts below show how much of the daily needs can be covered by 300 grams of the food.
2
100 g
300 g
1 fruit without refuse - 92g
Vitamin C
Vit. C
Vitamin D
Vit. D
Vitamin A
Vit. A
Vitamin E
Vit. E
Vitamin B1
Vit. B1
Vitamin B2
Vit. B2
Vitamin B3
Vit. B3
Vitamin B5
Vit. B5
Vitamin B6
Vit. B6
Vitamin B12
Vit. B12
Vitamin K
Vit. K
Folate
Folate
50%
0%
0.67%
0%
5%
6.9%
3.8%
4.9%
9.2%
0%
0%
2.3%
7
100 g
300 g
1 small (2-1/3" dia) - 129g 1 NLEA serving - 140g 1 medium (2-1/2" dia) - 142g 1 cup slices - 143g 1 large (2-3/4" dia) - 156g
Vitamin C
Vit. C
Vitamin D
Vit. D
Vitamin A
Vit. A
Vitamin E
Vit. E
Vitamin B1
Vit. B1
Vitamin B2
Vit. B2
Vitamin B3
Vit. B3
Vitamin B5
Vit. B5
Vitamin B6
Vit. B6
Vitamin B12
Vit. B12
Vitamin K
Vit. K
Folate
Folate
18%
0%
5.7%
15%
8.5%
6.2%
21%
11%
5.8%
0%
5.5%
3.8%
All nutrients comparison - raw data values
Nutrient
DV% diff.
Vitamin C
15mg
5.4mg
11%
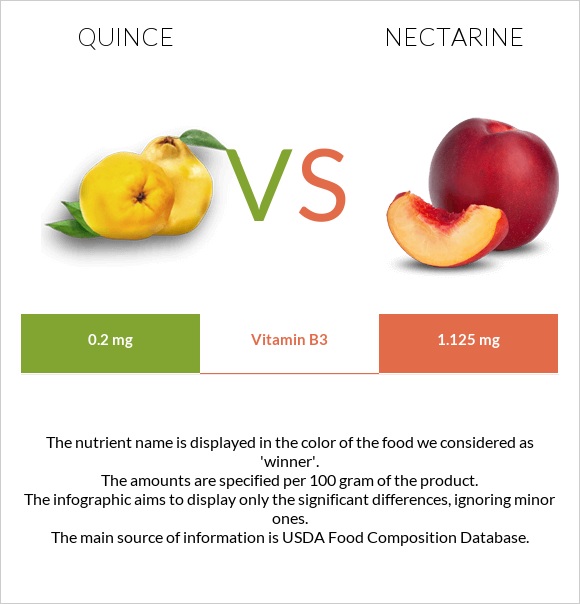
Vitamin B3
0.2mg
1.125mg
6%
Iron
0.7mg
0.28mg
5%
Copper
0.13mg
0.086mg
5%
Vitamin E
0.77mg
5%
Carbs
15.3g
10.55g
2%
Vitamin A
2µg
17µg
2%
Manganese
0.054mg
2%
Vitamin B5
0.081mg
0.185mg
2%
Vitamin K
2.2µg
2%
Fructose
1.37g
2%
Calories
57kcal
44kcal
1%
Protein
0.4g
1.06g
1%
Calcium
11mg
6mg
1%
Fiber
1.9g
1.7g
1%
Zinc
0.04mg
0.17mg
1%
Phosphorus
17mg
26mg
1%
Selenium
0.6µg
0µg
1%
Vitamin B1
0.02mg
0.034mg
1%
Vitamin B6
0.04mg
0.025mg
1%
Folate
3µg
5µg
1%
Choline
6.2mg
1%
Protein per 100 calories
0.7g
2.4g
N/A
Calories per 10 g protein
1425kcal
415kcal
N/A
Weight per 100 calories
175g
227g
N/A
Fats
0.1g
0.32g
0%
Net carbs
13.4g
8.85g
N/A
Magnesium
8mg
9mg
0%
Potassium
197mg
201mg
0%
Sugar
7.89g
N/A
Starch
0.07g
0%
Sodium
4mg
0mg
0%
Vitamin B2
0.03mg
0.027mg
0%
Saturated fat
0.01g
0.025g
0%
Monounsaturated fat
0.036g
0.088g
0%
Polyunsaturated fat
0.05g
0.113g
0%
Tryptophan
0.005mg
0%
Threonine
0.009mg
0%
Isoleucine
0.009mg
0%
Leucine
0.014mg
0%
Lysine
0.016mg
0%
Methionine
0.006mg
0%
Phenylalanine
0.021mg
0%
Valine
0.013mg
0%
Histidine
0.008mg
0%
Macronutrient Comparison
Macronutrient breakdown side-by-side comparison
1
15%
84%
Protein:
0.4 g
Fats:
0.1 g
Carbs:
15.3 g
Water:
83.8 g
Other:
0.4 g
4
11%
88%
Protein:
1.06 g
Fats:
0.32 g
Carbs:
10.55 g
Water:
87.59 g
Other:
0.48 g
Contains
more
Carbs Carbs
+45%
Contains
more
Protein Protein
+165%
Contains
more
Fats Fats
+220%
Contains
more
Other Other
+20%
Fat Type Comparison
Fat type breakdown side-by-side comparison
1
10%
38%
52%
Saturated fat:
Sat. Fat
0.01 g
Monounsaturated fat:
Mono. Fat
0.036 g
Polyunsaturated fat:
Poly. Fat
0.05 g
2
11%
39%
50%
Saturated fat:
Sat. Fat
0.025 g
Monounsaturated fat:
Mono. Fat
0.088 g
Polyunsaturated fat:
Poly. Fat
0.113 g
Contains
less
Sat. Fat Saturated fat
-60%
Contains
more
Mono. Fat Monounsaturated fat
+144.4%
Contains
more
Poly. Fat Polyunsaturated fat
+126%