Quinoa vs. Amaranth — Health Impact and Nutrition Comparison


Summary
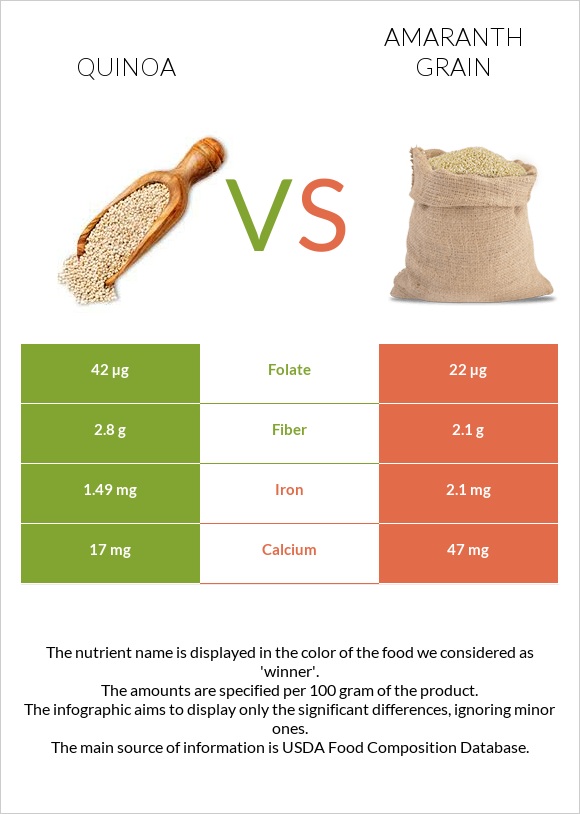
Amaranth grain is richer in calcium, manganese, and iron. It is also lower in sodium and sugar.
Quinoa has a lower glycemic index and is richer in Vitamin B1, B2, zinc, potassium, and copper.
Introduction
We will discuss quinoa and amaranth similarities and differences, focusing on nutrition and health impact.
What's The Actual Difference?
Both quinoa and amaranth fall into the pseudocereal category; however, they are consumed in the same way: cooked similarly to rice or oats.
Despite similarities, these grains have a few differences, such as appearance and nutritional values.
Amaranth is about the size of sesame seeds and has a yellowish color, while quinoa is about 2 mm in diameter and can be white, red, yellow, purple, brown, or black.
Nutrition
Below, nutrition infographics visually show the differences between cooked quinoa and cooked amaranth.
Calories
Amaranth has 102 calories per 100g, while quinoa contains only 120 calories per 100g.
Vitamins
Quinoa contains more vitamins than amaranth. It has more Vitamin B1, Vitamin B2, Vitamin B3, Vitamin E, and Folate.
The amount of Vitamin B1 is six times higher in quinoa.
The amounts of Vitamin A and Vitamin B1 are equal in these foods.
Both have no Vitamin D, A, K, or B12.
Vitamin Comparison
Contains
more
Vitamin EVitamin E
+231.6%
Contains
more
Vitamin B1Vitamin B1
+613.3%
Contains
more
Vitamin B2Vitamin B2
+400%
Contains
more
Vitamin B3Vitamin B3
+75.3%
Contains
more
FolateFolate
+90.9%
Minerals
Quinoa has more copper, potassium, and zinc.
On the other hand, amaranth has less sodium and more calcium than quinoa.
Both contain an equal amount of phosphorus and magnesium.
Mineral Comparison
Contains
more
PotassiumPotassium
+27.4%
Contains
more
CopperCopper
+28.9%
Contains
more
ZincZinc
+26.7%
Contains
more
CalciumCalcium
+176.5%
Contains
more
IronIron
+40.9%
Contains
less
SodiumSodium
-14.3%
Contains
more
ManganeseManganese
+35.3%
Contains
more
SeleniumSelenium
+96.4%
Glycemic Index
Quinoa also has a glycemic index of 53, making it a low-GI food. The glycemic index of cooked amaranth grain is 97, which is considered high GI.
Fats
Quinoa contains 1.92g of fat, and amaranth has 1.58g of fat.
Carbs
Quinoa has 21.3g per 100g, whereas amaranth has 19g per 100g. They both have high net carbs and fiber.
Cholesterol
Both have no cholesterol.
Health Impact
Diabetes
Quinoa contains essential amino acids like lysine, leucine, and sulfur. According to research, patients with type 2 diabetes who consume amino acids have lower blood glucose levels without changing their plasma insulin levels [1]. Besides, it is high in dietary fiber and can also be beneficial for people with diabetes since fiber and protein are essential for keeping blood sugar under control [2].
The effect of amaranth on blood glucose levels appears to be debatable. Some studies claim that consuming grain or oil may protect against insulin deficiency, while others claim that starch's high glycemic index is a liability for diabetic patients [3].
References

Infographic
All nutrients comparison - raw data values
| Nutrient | |
|
DV% diff. |
| Manganese | 0.631mg | 0.854mg | 10% |
| Iron | 1.49mg | 2.1mg | 8% |
| Vitamin B1 | 0.107mg | 0.015mg | 8% |
| Vitamin B2 | 0.11mg | 0.022mg | 7% |
| Polyunsaturated fat | 1.078g | 7% | |
| Copper | 0.192mg | 0.149mg | 5% |
| Selenium | 2.8µg | 5.5µg | 5% |
| Folate | 42µg | 22µg | 5% |
| Choline | 23mg | 4% | |
| Calcium | 17mg | 47mg | 3% |
| Fiber | 2.8g | 2.1g | 3% |
| Vitamin E | 0.63mg | 0.19mg | 3% |
| Zinc | 1.09mg | 0.86mg | 2% |
| Calories | 120kcal | 102kcal | 1% |
| Protein | 4.4g | 3.8g | 1% |
| Fats | 1.92g | 1.58g | 1% |
| Carbs | 21.3g | 18.69g | 1% |
| Potassium | 172mg | 135mg | 1% |
| Starch | 17.63g | 16.23g | 1% |
| Phosphorus | 152mg | 148mg | 1% |
| Vitamin B3 | 0.412mg | 0.235mg | 1% |
| Vitamin B6 | 0.123mg | 0.113mg | 1% |
| Saturated fat | 0.231g | 1% | |
| Monounsaturated fat | 0.528g | 1% | |
| Net carbs | 18.5g | 16.59g | N/A |
| Magnesium | 64mg | 65mg | 0% |
| Sugar | 0.87g | N/A | |
| Sodium | 7mg | 6mg | 0% |
| Tryptophan | 0.052mg | 0% | |
| Threonine | 0.131mg | 0% | |
| Isoleucine | 0.157mg | 0% | |
| Leucine | 0.261mg | 0% | |
| Lysine | 0.239mg | 0% | |
| Methionine | 0.096mg | 0% | |
| Phenylalanine | 0.185mg | 0% | |
| Valine | 0.185mg | 0% | |
| Histidine | 0.127mg | 0% | |
| Omega-3 - DHA | 0.015g | N/A |
Macronutrient Comparison
| Contains more ProteinProtein | +15.8% |
| Contains more FatsFats | +21.5% |
| Contains more CarbsCarbs | +14% |
Carbohydrate type comparison
People also compare


References
All the values for which the sources are not specified explicitly are taken from FDA’s Food Central. The exact link to the food presented on this page can be found below.
- Quinoa - https://fdc.nal.usda.gov/fdc-app.html#/food-details/168917/nutrients
- Amaranth - https://fdc.nal.usda.gov/fdc-app.html#/food-details/170683/nutrients
All the Daily Values are presented for males aged 31-50, for 2000-calorie diets.