Rice vs. Rice — In-Depth Nutrition Comparison
Compare
Significant differences between rice and rice
- The amount of folate, iron, vitamin B1, and vitamin B3 in rice is higher than in rice.
- Rice covers your daily folate needs 14% more than rice.
- Rice has 8 times less vitamin B1 than rice. Rice has 0.163mg of vitamin B1, while rice has 0.02mg.
Specific food types used in this comparison are Rice, white, long-grain, regular, enriched, cooked and Rice, white, long-grain, regular, unenriched, cooked without salt.
Infographic
Infographic link
Mineral Comparison
Mineral comparison score is based on the number of minerals by which one or the other food is richer. The "coverage" charts below show how much of the daily needs can be covered by 300 grams of the food.
Vitamin Comparison
Vitamin comparison score is based on the number of vitamins by which one or the other food is richer. The "coverage" charts below show how much of the daily needs can be covered by 300 grams of the food.
| Contains more Vitamin B1Vitamin B1 | +715% |
| Contains more Vitamin B3Vitamin B3 | +269% |
| Contains more FolateFolate | +1833.3% |
All nutrients comparison - raw data values
| Nutrient |  |
|
DV% diff. |
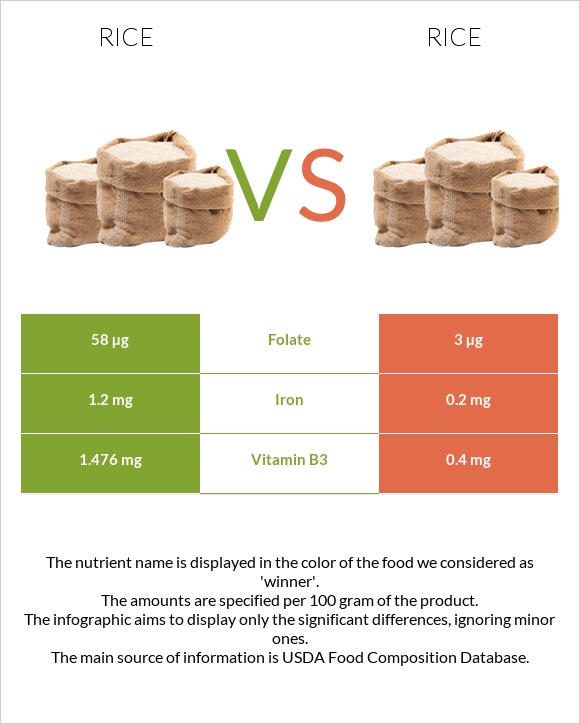
| Folate | 58µg | 3µg | 14% |
| Iron | 1.2mg | 0.2mg | 13% |
| Vitamin B1 | 0.163mg | 0.02mg | 12% |
| Vitamin B3 | 1.476mg | 0.4mg | 7% |
| Calories | 130kcal | 130kcal | 0% |
| Protein | 2.69g | 2.69g | 0% |
| Fats | 0.28g | 0.28g | 0% |
| Net carbs | 27.77g | 27.77g | N/A |
| Carbs | 28.17g | 28.17g | 0% |
| Magnesium | 12mg | 12mg | 0% |
| Calcium | 10mg | 10mg | 0% |
| Potassium | 35mg | 35mg | 0% |
| Sugar | 0.05g | 0.05g | N/A |
| Fiber | 0.4g | 0.4g | 0% |
| Copper | 0.069mg | 0.069mg | 0% |
| Zinc | 0.49mg | 0.49mg | 0% |
| Phosphorus | 43mg | 43mg | 0% |
| Sodium | 1mg | 1mg | 0% |
| Vitamin E | 0.04mg | 0.04mg | 0% |
| Manganese | 0.472mg | 0.472mg | 0% |
| Selenium | 7.5µg | 7.5µg | 0% |
| Vitamin B2 | 0.013mg | 0.013mg | 0% |
| Vitamin B5 | 0.39mg | 0.39mg | 0% |
| Vitamin B6 | 0.093mg | 0.093mg | 0% |
| Choline | 2.1mg | 2.1mg | 0% |
| Saturated fat | 0.077g | 0.077g | 0% |
| Monounsaturated fat | 0.088g | 0.088g | 0% |
| Polyunsaturated fat | 0.076g | 0.076g | 0% |
| Tryptophan | 0.031mg | 0.031mg | 0% |
| Threonine | 0.096mg | 0.096mg | 0% |
| Isoleucine | 0.116mg | 0.116mg | 0% |
| Leucine | 0.222mg | 0.222mg | 0% |
| Lysine | 0.097mg | 0.097mg | 0% |
| Methionine | 0.063mg | 0.063mg | 0% |
| Phenylalanine | 0.144mg | 0.144mg | 0% |
| Valine | 0.164mg | 0.164mg | 0% |
| Histidine | 0.063mg | 0.063mg | 0% |
Macronutrient Comparison
Macronutrient breakdown side-by-side comparison
~equal in
Protein
~2.69g
~equal in
Fats
~0.28g
~equal in
Carbs
~28.17g
~equal in
Water
~68.44g
~equal in
Other
~0.42g
Fat Type Comparison
Fat type breakdown side-by-side comparison
~equal in
Saturated fat
~0.077g
~equal in
Monounsaturated fat
~0.088g
~equal in
Polyunsaturated fat
~0.076g