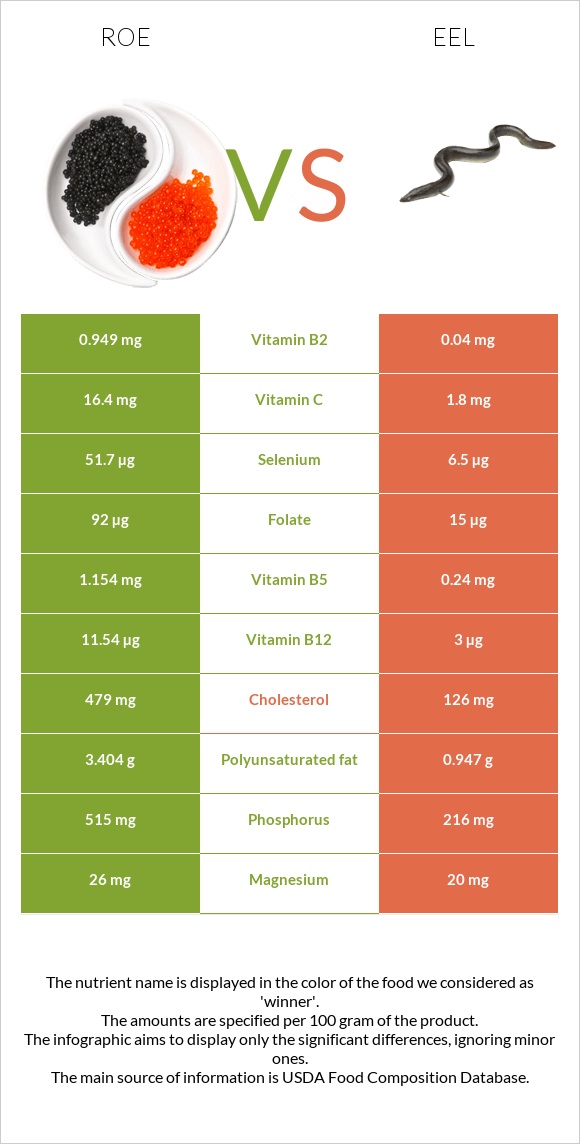
Summary of differences between roe and eels Roe has more vitamin B12, selenium, vitamin B2, phosphorus, folate, vitamin B5, and vitamin C; however, eels are higher in vitamin A and vitamin B3. Roe covers your daily need for vitamin B12, 360% more than eels. Roe has 19 times more vitamin B2 than eels. While roe has 0.949mg of vitamin B2, eels have only 0.051mg. Eels have less cholesterol. The glycemic index of roe is higher. These are the specific foods used in this comparison Fish, roe, mixed species, cooked, dry heat and Fish, eel, mixed species, cooked, dry heat .
Infographic
Mineral Comparison
Mineral comparison score is based on the number of minerals by which one or the other food is richer. The "coverage" charts below show how much of the daily needs can be covered by 300 grams of the food.
4
100 g
300 g
1 oz - 28.35g 3 oz - 85g
Magnesium
Magnesium
Calcium
Calcium
Potassium
Potassium
Iron
Iron
Copper
Copper
Zinc
Zinc
Phosphorus
Phosphorus
Sodium
Sodium
Manganese
Manganese
Selenium
Selenium
19%
8.4%
25%
29%
43%
35%
221%
15%
1.7%
282%
4
100 g
300 g
1 cubic inch, boneless - 17g 1 oz with bone (yield after bone removed) - 22g 1 oz, boneless - 28.35g 3 oz - 85g 1 fillet - 159g
Magnesium
Magnesium
Calcium
Calcium
Potassium
Potassium
Iron
Iron
Copper
Copper
Zinc
Zinc
Phosphorus
Phosphorus
Sodium
Sodium
Manganese
Manganese
Selenium
Selenium
19%
7.8%
31%
24%
9.7%
57%
119%
8.5%
5.2%
45%
Vitamin Comparison
Vitamin comparison score is based on the number of vitamins by which one or the other food is richer. The "coverage" charts below show how much of the daily needs can be covered by 300 grams of the food.
7
100 g
300 g
1 oz - 28.35g 3 oz - 85g
Vitamin C
Vit. C
Vitamin D
Vit. D
Vitamin A
Vit. A
Vitamin E
Vit. E
Vitamin B1
Vit. B1
Vitamin B2
Vit. B2
Vitamin B3
Vit. B3
Vitamin B5
Vit. B5
Vitamin B6
Vit. B6
Vitamin B12
Vit. B12
Vitamin K
Vit. K
Folate
Folate
55%
0%
30%
0%
69%
219%
41%
69%
43%
1443%
0%
69%
2
100 g
300 g
1 cubic inch, boneless - 17g 1 oz with bone (yield after bone removed) - 22g 1 oz, boneless - 28.35g 3 oz - 85g 1 fillet - 159g
Vitamin C
Vit. C
Vitamin D
Vit. D
Vitamin A
Vit. A
Vitamin E
Vit. E
Vitamin B1
Vit. B1
Vitamin B2
Vit. B2
Vitamin B3
Vit. B3
Vitamin B5
Vit. B5
Vitamin B6
Vit. B6
Vitamin B12
Vit. B12
Vitamin K
Vit. K
Folate
Folate
6%
0%
379%
0%
46%
12%
84%
17%
18%
361%
0%
13%
All nutrients comparison - raw data values
Nutrient
DV% diff.
Vitamin B12
11.54µg
2.89µg
360%
Vitamin A
91µg
1137µg
116%
Cholesterol
479mg
161mg
106%
Selenium
51.7µg
8.3µg
79%
Vitamin B2
0.949mg
0.051mg
69%
Phosphorus
515mg
277mg
34%
Folate
92µg
17µg
19%
Monounsaturated fat
2.129g
9.218g
18%
Vitamin B5
1.154mg
0.28mg
17%
Vitamin C
16.4mg
1.8mg
16%
Polyunsaturated fat
3.404g
1.214g
15%
Vitamin B3
2.192mg
4.487mg
14%
Copper
0.128mg
0.029mg
11%
Protein
28.62g
23.65g
10%
Fats
8.23g
14.95g
10%
Vitamin B1
0.277mg
0.183mg
8%
Vitamin B6
0.185mg
0.077mg
8%
Zinc
1.28mg
2.08mg
7%
Saturated fat
1.866g
3.023g
5%
Calories
204kcal
236kcal
2%
Potassium
283mg
349mg
2%
Iron
0.77mg
0.64mg
2%
Sodium
117mg
65mg
2%
Carbs
1.92g
0g
1%
Manganese
0.013mg
0.04mg
1%
Protein per 100 calories
14g
10g
N/A
Calories per 10 g protein
71kcal
100kcal
N/A
Weight per 100 calories
49g
42g
N/A
Unsaturated / Saturated Fat ratio
3
3.5
N/A
Net carbs
1.92g
0g
N/A
Magnesium
26mg
26mg
0%
Calcium
28mg
26mg
0%
Tryptophan
0.375mg
0.265mg
0%
Threonine
1.305mg
1.037mg
0%
Isoleucine
1.465mg
1.09mg
0%
Leucine
2.509mg
1.922mg
0%
Lysine
2.179mg
2.171mg
0%
Methionine
0.71mg
0.7mg
0%
Phenylalanine
1.401mg
0.923mg
0%
Valine
1.676mg
1.218mg
0%
Histidine
0.778mg
0.696mg
0%
Omega-3 - EPA
1.26g
0.108g
N/A
Omega-3 - DHA
1.747g
0.081g
N/A
Omega-3 - DPA
0.105g
0.095g
N/A
Macronutrient Comparison
Macronutrient breakdown side-by-side comparison
3
29%
8%
2%
59%
3%
Protein:
28.62 g
Fats:
8.23 g
Carbs:
1.92 g
Water:
58.63 g
Other:
2.6 g
2
24%
15%
59%
2%
Protein:
23.65 g
Fats:
14.95 g
Carbs:
0 g
Water:
59.31 g
Other:
2.09 g
Contains
more
Protein Protein
+21%
Contains
more
Carbs Carbs
+∞%
Contains
more
Other Other
+24.4%
Contains
more
Fats Fats
+81.7%
Fat Type Comparison
Fat type breakdown side-by-side comparison
2
25%
29%
46%
Saturated fat:
Sat. Fat
1.866 g
Monounsaturated fat:
Mono. Fat
2.129 g
Polyunsaturated fat:
Poly. Fat
3.404 g
1
22%
69%
9%
Saturated fat:
Sat. Fat
3.023 g
Monounsaturated fat:
Mono. Fat
9.218 g
Polyunsaturated fat:
Poly. Fat
1.214 g
Contains
less
Sat. Fat Saturated fat
-38.3%
Contains
more
Poly. Fat Polyunsaturated fat
+180.4%
Contains
more
Mono. Fat Monounsaturated fat
+333%