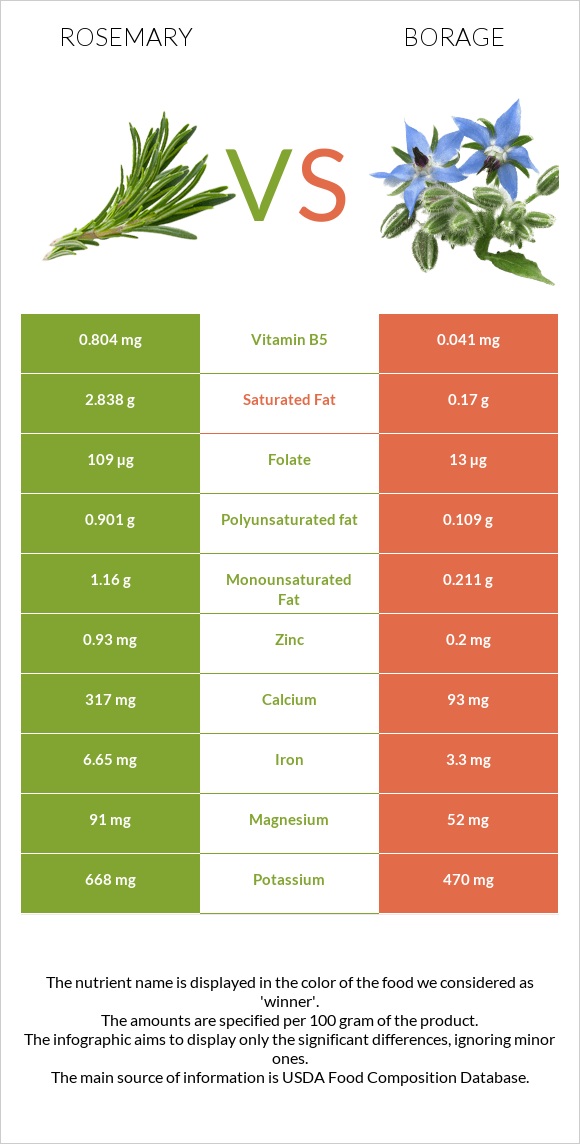
What are the main differences between rosemary and borage? Rosemary is richer in iron, manganese, folate, calcium, vitamin B6, copper, and vitamin B5, yet borage is richer in vitamin A and vitamin C. Rosemary's daily need coverage for iron is 42% higher. Rosemary has 20 times more vitamin B5 than borage. Rosemary has 0.804mg of vitamin B5, while borage has 0.041mg. Borage contains less saturated fat. We used Rosemary, fresh and Borage, raw types in this comparison.
Infographic
Mineral Comparison
Mineral comparison score is based on the number of minerals by which one or the other food is richer. The "coverage" charts below show how much of the daily needs can be covered by 300 grams of the food.
9
100 g
300 g
1 tsp - 0.7g 1 tbsp - 1.7g
Magnesium
Magnesium
Calcium
Calcium
Potassium
Potassium
Iron
Iron
Copper
Copper
Zinc
Zinc
Phosphorus
Phosphorus
Sodium
Sodium
Manganese
Manganese
Selenium
Selenium
65%
95%
59%
249%
100%
25%
28%
3.4%
125%
0%
1
100 g
300 g
1 cup (1" pieces) - 89g
Magnesium
Magnesium
Calcium
Calcium
Potassium
Potassium
Iron
Iron
Copper
Copper
Zinc
Zinc
Phosphorus
Phosphorus
Sodium
Sodium
Manganese
Manganese
Selenium
Selenium
37%
28%
41%
124%
43%
5.5%
23%
10%
46%
4.9%
Vitamin Comparison
Vitamin comparison score is based on the number of vitamins by which one or the other food is richer. The "coverage" charts below show how much of the daily needs can be covered by 300 grams of the food.
3
100 g
300 g
1 tsp - 0.7g 1 tbsp - 1.7g
Vitamin C
Vit. C
Vitamin D
Vit. D
Vitamin A
Vit. A
Vitamin E
Vit. E
Vitamin B1
Vit. B1
Vitamin B2
Vit. B2
Vitamin B3
Vit. B3
Vitamin B5
Vit. B5
Vitamin B6
Vit. B6
Vitamin B12
Vit. B12
Vitamin K
Vit. K
Folate
Folate
73%
0%
49%
0%
9%
35%
17%
48%
78%
0%
0%
82%
3
100 g
300 g
1 cup (1" pieces) - 89g
Vitamin C
Vit. C
Vitamin D
Vit. D
Vitamin A
Vit. A
Vitamin E
Vit. E
Vitamin B1
Vit. B1
Vitamin B2
Vit. B2
Vitamin B3
Vit. B3
Vitamin B5
Vit. B5
Vitamin B6
Vit. B6
Vitamin B12
Vit. B12
Vitamin K
Vit. K
Folate
Folate
117%
0%
70%
0%
15%
35%
17%
2.5%
19%
0%
0%
9.8%
All nutrients comparison - raw data values
Nutrient
DV% diff.
Fiber
14.1g
56%
Iron
6.65mg
3.3mg
42%
Manganese
0.96mg
0.349mg
27%
Folate
109µg
13µg
24%
Calcium
317mg
93mg
22%
Copper
0.301mg
0.13mg
19%
Vitamin B6
0.336mg
0.084mg
19%
Vitamin C
21.8mg
35mg
15%
Vitamin B5
0.804mg
0.041mg
15%
Saturated fat
2.838g
0.17g
12%
Magnesium
91mg
52mg
9%
Fats
5.86g
0.7g
8%
Zinc
0.93mg
0.2mg
7%
Vitamin A
146µg
210µg
7%
Calories
131kcal
21kcal
6%
Carbs
20.7g
3.06g
6%
Potassium
668mg
470mg
6%
Polyunsaturated fat
0.901g
0.109g
5%
Protein
3.31g
1.8g
3%
Phosphorus
66mg
53mg
2%
Sodium
26mg
80mg
2%
Selenium
0.9µg
2%
Vitamin B1
0.036mg
0.06mg
2%
Monounsaturated fat
1.16g
0.211g
2%
Protein per 100 calories
2.5g
8.6g
N/A
Calories per 10 g protein
396kcal
117kcal
N/A
Weight per 100 calories
76g
476g
N/A
Unsaturated / Saturated Fat ratio
0.73
1.9
N/A
Net carbs
6.6g
3.06g
N/A
Vitamin B2
0.152mg
0.15mg
0%
Vitamin B3
0.912mg
0.9mg
0%
Tryptophan
0.051mg
0%
Threonine
0.136mg
0%
Isoleucine
0.136mg
0%
Leucine
0.249mg
0%
Lysine
0.143mg
0%
Methionine
0.047mg
0%
Phenylalanine
0.169mg
0%
Valine
0.165mg
0%
Histidine
0.066mg
0%
Macronutrient Comparison
Macronutrient breakdown side-by-side comparison
4
3%
6%
21%
68%
2%
Protein:
3.31 g
Fats:
5.86 g
Carbs:
20.7 g
Water:
67.77 g
Other:
2.36 g
1
2%
3%
93%
Protein:
1.8 g
Fats:
0.7 g
Carbs:
3.06 g
Water:
93 g
Other:
1.44 g
Contains
more
Protein Protein
+83.9%
Contains
more
Fats Fats
+737.1%
Contains
more
Carbs Carbs
+576.5%
Contains
more
Other Other
+63.9%
Contains
more
Water Water
+37.2%
Fat Type Comparison
Fat type breakdown side-by-side comparison
2
58%
24%
18%
Saturated fat:
Sat. Fat
2.838 g
Monounsaturated fat:
Mono. Fat
1.16 g
Polyunsaturated fat:
Poly. Fat
0.901 g
1
35%
43%
22%
Saturated fat:
Sat. Fat
0.17 g
Monounsaturated fat:
Mono. Fat
0.211 g
Polyunsaturated fat:
Poly. Fat
0.109 g
Contains
more
Mono. Fat Monounsaturated fat
+449.8%
Contains
more
Poly. Fat Polyunsaturated fat
+726.6%
Contains
less
Sat. Fat Saturated fat
-94%