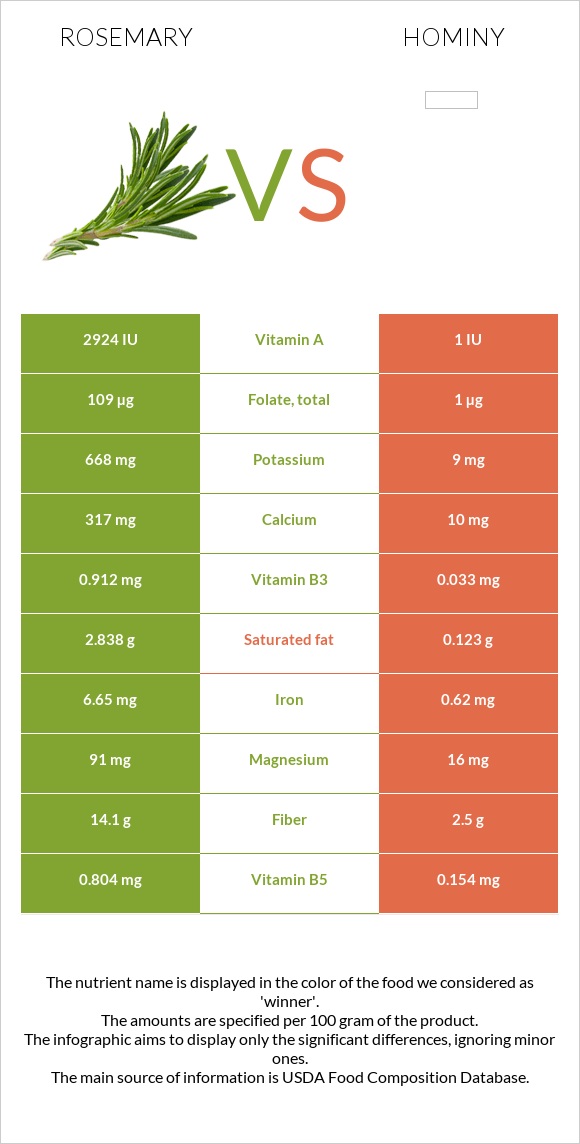
Summary of differences between rosemary and hominy The amount of iron, vitamin A, fiber, manganese, calcium, copper, folate, vitamin B6, vitamin C, and potassium in rosemary is higher than in hominy. Rosemary covers your daily need for iron, 75% more than hominy. Hominy has a lower glycemic index. The glycemic index of hominy is 40, while the glycemic index of rosemary is 70. These are the specific foods used in this comparison Rosemary, fresh and Hominy, canned, white .
Infographic
Mineral Comparison
Mineral comparison score is based on the number of minerals by which one or the other food is richer. The "coverage" charts below show how much of the daily needs can be covered by 300 grams of the food.
8
100 g
300 g
1 tsp - 0.7g 1 tbsp - 1.7g
Magnesium
Magnesium
Calcium
Calcium
Potassium
Potassium
Iron
Iron
Copper
Copper
Zinc
Zinc
Phosphorus
Phosphorus
Sodium
Sodium
Manganese
Manganese
Selenium
Selenium
65%
95%
59%
249%
100%
25%
28%
3.4%
125%
0%
2
100 g
300 g
1 cup - 165g
Magnesium
Magnesium
Calcium
Calcium
Potassium
Potassium
Iron
Iron
Copper
Copper
Zinc
Zinc
Phosphorus
Phosphorus
Sodium
Sodium
Manganese
Manganese
Selenium
Selenium
11%
3%
0.79%
23%
10%
29%
15%
45%
9.1%
16%
Vitamin Comparison
Vitamin comparison score is based on the number of vitamins by which one or the other food is richer. The "coverage" charts below show how much of the daily needs can be covered by 300 grams of the food.
8
100 g
300 g
1 tsp - 0.7g 1 tbsp - 1.7g
Vitamin C
Vit. C
Vitamin D
Vit. D
Vitamin A
Vit. A
Vitamin E
Vit. E
Vitamin B1
Vit. B1
Vitamin B2
Vit. B2
Vitamin B3
Vit. B3
Vitamin B5
Vit. B5
Vitamin B6
Vit. B6
Vitamin B12
Vit. B12
Vitamin K
Vit. K
Folate
Folate
73%
0%
49%
0%
9%
35%
17%
48%
78%
0%
0%
82%
2
100 g
300 g
1 cup - 165g
Vitamin C
Vit. C
Vitamin D
Vit. D
Vitamin A
Vit. A
Vitamin E
Vit. E
Vitamin B1
Vit. B1
Vitamin B2
Vit. B2
Vitamin B3
Vit. B3
Vitamin B5
Vit. B5
Vitamin B6
Vit. B6
Vitamin B12
Vit. B12
Vitamin K
Vit. K
Folate
Folate
0%
0%
0%
1%
0.75%
1.4%
0.62%
9.2%
1.2%
0%
0.5%
0.75%
All nutrients comparison - raw data values
Nutrient
DV% diff.
Iron
6.65mg
0.62mg
75%
Fiber
14.1g
2.5g
46%
Manganese
0.96mg
0.07mg
39%
Calcium
317mg
10mg
31%
Copper
0.301mg
0.03mg
30%
Folate
109µg
1µg
27%
Vitamin B6
0.336mg
0.005mg
25%
Vitamin C
21.8mg
0mg
24%
Potassium
668mg
9mg
19%
Magnesium
91mg
16mg
18%
Vitamin A
146µg
0µg
16%
Sodium
26mg
345mg
14%
Vitamin B5
0.804mg
0.154mg
13%
Saturated fat
2.838g
0.123g
12%
Vitamin B2
0.152mg
0.006mg
11%
Fats
5.86g
0.88g
8%
Selenium
3µg
5%
Vitamin B3
0.912mg
0.033mg
5%
Protein
3.31g
1.48g
4%
Phosphorus
66mg
35mg
4%
Calories
131kcal
72kcal
3%
Vitamin B1
0.036mg
0.003mg
3%
Polyunsaturated fat
0.901g
0.399g
3%
Carbs
20.7g
14.26g
2%
Monounsaturated fat
1.16g
0.231g
2%
Zinc
0.93mg
1.05mg
1%
Choline
3.1mg
1%
Protein per 100 calories
2.5g
2.1g
N/A
Calories per 10 g protein
396kcal
486kcal
N/A
Weight per 100 calories
76g
139g
N/A
Unsaturated / Saturated Fat ratio
0.73
5.1
N/A
Net carbs
6.6g
11.76g
N/A
Sugar
1.82g
N/A
Vitamin E
0.05mg
0%
Vitamin K
0.2µg
0%
Tryptophan
0.051mg
0.008mg
0%
Threonine
0.136mg
0.05mg
0%
Isoleucine
0.136mg
0.058mg
0%
Leucine
0.249mg
0.202mg
0%
Lysine
0.143mg
0.033mg
0%
Methionine
0.047mg
0.031mg
0%
Phenylalanine
0.169mg
0.076mg
0%
Valine
0.165mg
0.077mg
0%
Histidine
0.066mg
0.045mg
0%
Macronutrient Comparison
Macronutrient breakdown side-by-side comparison
4
3%
6%
21%
68%
2%
Protein:
3.31 g
Fats:
5.86 g
Carbs:
20.7 g
Water:
67.77 g
Other:
2.36 g
1
14%
83%
Protein:
1.48 g
Fats:
0.88 g
Carbs:
14.26 g
Water:
82.53 g
Other:
0.85 g
Contains
more
Protein Protein
+123.6%
Contains
more
Fats Fats
+565.9%
Contains
more
Carbs Carbs
+45.2%
Contains
more
Other Other
+177.6%
Contains
more
Water Water
+21.8%
Fat Type Comparison
Fat type breakdown side-by-side comparison
2
58%
24%
18%
Saturated fat:
Sat. Fat
2.838 g
Monounsaturated fat:
Mono. Fat
1.16 g
Polyunsaturated fat:
Poly. Fat
0.901 g
1
16%
31%
53%
Saturated fat:
Sat. Fat
0.123 g
Monounsaturated fat:
Mono. Fat
0.231 g
Polyunsaturated fat:
Poly. Fat
0.399 g
Contains
more
Mono. Fat Monounsaturated fat
+402.2%
Contains
more
Poly. Fat Polyunsaturated fat
+125.8%
Contains
less
Sat. Fat Saturated fat
-95.7%