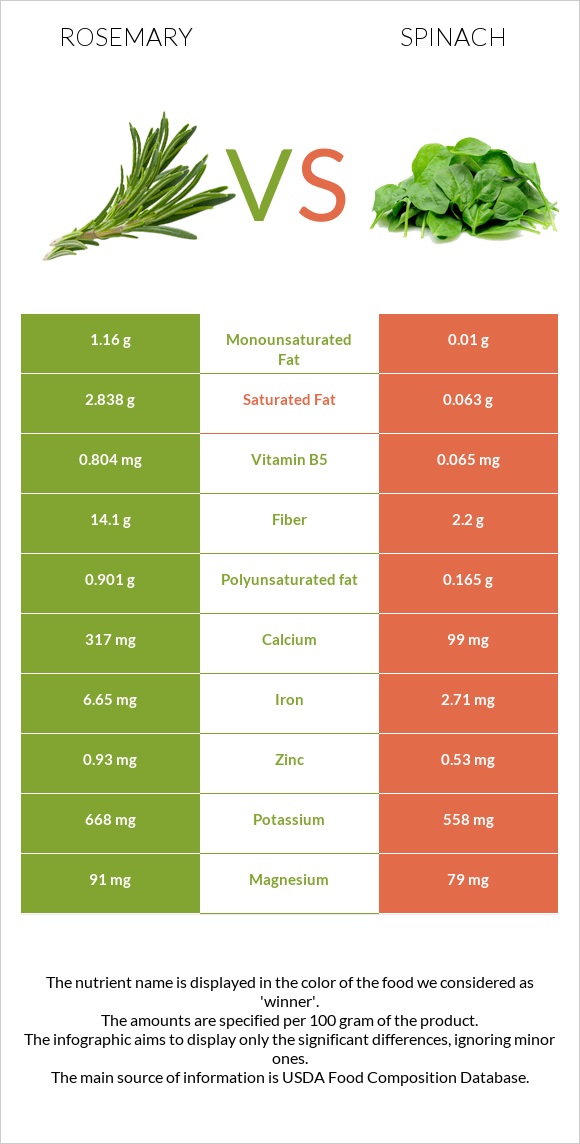
Differences between rosemary and spinach Rosemary has more fiber, iron, calcium, copper, vitamin C, vitamin B5, and vitamin B6, while spinach has more vitamin A and folate. Spinach's daily need coverage for vitamin A is 151% higher. Spinach contains 66 times less saturated fat than rosemary. Rosemary contains 2.838g of saturated fat, while spinach contains 0.043g. Spinach has a lower glycemic index. The glycemic index of spinach is 32, while the glycemic index of rosemary is 70. The food types used in this comparison are Rosemary, fresh and Spinach, cooked, boiled, drained, without salt .
Infographic
Mineral Comparison
Mineral comparison score is based on the number of minerals by which one or the other food is richer. The "coverage" charts below show how much of the daily needs can be covered by 300 grams of the food.
7
100 g
300 g
1 tsp - 0.7g 1 tbsp - 1.7g
Magnesium
Magnesium
Calcium
Calcium
Potassium
Potassium
Iron
Iron
Copper
Copper
Zinc
Zinc
Phosphorus
Phosphorus
Sodium
Sodium
Manganese
Manganese
Selenium
Selenium
65%
95%
59%
249%
100%
25%
28%
3.4%
125%
0%
1
100 g
300 g
1 cup - 180g
Magnesium
Magnesium
Calcium
Calcium
Potassium
Potassium
Iron
Iron
Copper
Copper
Zinc
Zinc
Phosphorus
Phosphorus
Sodium
Sodium
Manganese
Manganese
Selenium
Selenium
62%
41%
41%
134%
58%
21%
24%
9.1%
122%
8.2%
Vitamin Comparison
Vitamin comparison score is based on the number of vitamins by which one or the other food is richer. The "coverage" charts below show how much of the daily needs can be covered by 300 grams of the food.
4
100 g
300 g
1 tsp - 0.7g 1 tbsp - 1.7g
Vitamin C
Vit. C
Vitamin D
Vit. D
Vitamin A
Vit. A
Vitamin E
Vit. E
Vitamin B1
Vit. B1
Vitamin B2
Vit. B2
Vitamin B3
Vit. B3
Vitamin B5
Vit. B5
Vitamin B6
Vit. B6
Vitamin B12
Vit. B12
Vitamin K
Vit. K
Folate
Folate
73%
0%
49%
0%
9%
35%
17%
48%
78%
0%
0%
82%
6
100 g
300 g
1 cup - 180g
Vitamin C
Vit. C
Vitamin D
Vit. D
Vitamin A
Vit. A
Vitamin E
Vit. E
Vitamin B1
Vit. B1
Vitamin B2
Vit. B2
Vitamin B3
Vit. B3
Vitamin B5
Vit. B5
Vitamin B6
Vit. B6
Vitamin B12
Vit. B12
Vitamin K
Vit. K
Folate
Folate
33%
0%
175%
42%
24%
54%
9.2%
8.7%
56%
0%
1234%
110%
All nutrients comparison - raw data values
Nutrient
DV% diff.
Vitamin K
493.6µg
411%
Fiber
14.1g
2.4g
47%
Vitamin A
146µg
524µg
42%
Iron
6.65mg
3.57mg
39%
Calcium
317mg
136mg
18%
Copper
0.301mg
0.174mg
14%
Vitamin E
2.08mg
14%
Vitamin C
21.8mg
9.8mg
13%
Vitamin B5
0.804mg
0.145mg
13%
Saturated fat
2.838g
0.043g
13%
Fats
5.86g
0.26g
9%
Folate
109µg
146µg
9%
Vitamin B6
0.336mg
0.242mg
7%
Carbs
20.7g
3.75g
6%
Potassium
668mg
466mg
6%
Vitamin B2
0.152mg
0.236mg
6%
Calories
131kcal
23kcal
5%
Vitamin B1
0.036mg
0.095mg
5%
Polyunsaturated fat
0.901g
0.109g
5%
Choline
19.7mg
4%
Selenium
1.5µg
3%
Vitamin B3
0.912mg
0.49mg
3%
Monounsaturated fat
1.16g
0.006g
3%
Zinc
0.93mg
0.76mg
2%
Sodium
26mg
70mg
2%
Protein
3.31g
2.97g
1%
Magnesium
91mg
87mg
1%
Phosphorus
66mg
56mg
1%
Manganese
0.96mg
0.935mg
1%
Protein per 100 calories
2.5g
13g
N/A
Calories per 10 g protein
396kcal
77kcal
N/A
Weight per 100 calories
76g
435g
N/A
Unsaturated / Saturated Fat ratio
0.73
2.7
N/A
Net carbs
6.6g
1.35g
N/A
Sugar
0.43g
N/A
Tryptophan
0.051mg
0.04mg
0%
Threonine
0.136mg
0.127mg
0%
Isoleucine
0.136mg
0.152mg
0%
Leucine
0.249mg
0.231mg
0%
Lysine
0.143mg
0.182mg
0%
Methionine
0.047mg
0.055mg
0%
Phenylalanine
0.169mg
0.134mg
0%
Valine
0.165mg
0.168mg
0%
Histidine
0.066mg
0.066mg
0%
Macronutrient Comparison
Macronutrient breakdown side-by-side comparison
4
3%
6%
21%
68%
2%
Protein:
3.31 g
Fats:
5.86 g
Carbs:
20.7 g
Water:
67.77 g
Other:
2.36 g
1
3%
4%
91%
2%
Protein:
2.97 g
Fats:
0.26 g
Carbs:
3.75 g
Water:
91.21 g
Other:
1.81 g
Contains
more
Protein Protein
+11.4%
Contains
more
Fats Fats
+2153.8%
Contains
more
Carbs Carbs
+452%
Contains
more
Other Other
+30.4%
Contains
more
Water Water
+34.6%
Fat Type Comparison
Fat type breakdown side-by-side comparison
2
58%
24%
18%
Saturated fat:
Sat. Fat
2.838 g
Monounsaturated fat:
Mono. Fat
1.16 g
Polyunsaturated fat:
Poly. Fat
0.901 g
1
27%
4%
69%
Saturated fat:
Sat. Fat
0.043 g
Monounsaturated fat:
Mono. Fat
0.006 g
Polyunsaturated fat:
Poly. Fat
0.109 g
Contains
more
Mono. Fat Monounsaturated fat
+19233.3%
Contains
more
Poly. Fat Polyunsaturated fat
+726.6%
Contains
less
Sat. Fat Saturated fat
-98.5%