Rutabaga vs. Turnip — Health Impact and Nutrition Comparison


Summary
Rutabagas are richer in fiber, phosphorus, potassium, and vitamins C, B1, and B6. In comparison, turnips are richer in copper.
Turnips and rutabagas are not very different concerning their health impacts. Their main difference is in their general aspects concerning taste, size, and appearance.
Introduction
This article is a comparison between rutabagas and turnips. We will be discussing the differences between them according to their general differences, nutritional composition, and health impacts.
Actual Differences
Appearance and classification
Rutabagas and turnips are somehow similar to one another. However, differences do exist between them.
Rutabaga, or Swedish turnip, is a root vegetable, a form of Brassica napus. This is actually a hybrid of cabbage and turnip. Turnip, or Brassica rapa, is a white taproot grown in temperate climates around the world.
Rutabagas are larger and have a darker brown color and some white and purple. In comparison, turnips are small and have a distinctive white and purple color.
Taste and Use
Regarding taste, rutabagas are closer to carrots, having a little bitter flavor and being similar to sweet carrots. While cooked, they become sweeter and taste like sweet potatoes. In contrast, turnips have a more bitter profile. They have a spicy and peppery flavor.
For their usage, turnips and rutabagas can be used interchangeably. They can replace carrots and potatoes in mashed or roasted forms.
Nutrition
Macronutrients
We will take into consideration 100g of each. As the chart below shows, turnip and rutabaga have similar nutrient profiles. However, turnip is slightly richer in water, while rutabaga has a higher carbohydrate content. Please, read more in the corresponding sections.
Macronutrient Comparison
Contains
more
ProteinProtein
+20%
Contains
more
FatsFats
+60%
Contains
more
CarbsCarbs
+34.1%
Carbs
Rutabagas are higher in carbs compared to turnips. Rutabagas contains 8.6g of carbs in comparison to turnips contain 6.4g. Rutabagas are mainly richer in sugars. This is why they taste sweeter than turnips.
Fiber
Rutabagas are richer in fiber. They contain 2.3g of dietary fiber, whereas turnips contain 1.8g. Rutabaga has a high soluble fiber content.
Protein and Fat
The protein and fat amounts are negligible, as both are root vegetables.
Fat Type Comparison
Contains
more
Mono. FatMonounsaturated fat
+316.7%
Contains
more
Poly. FatPolyunsaturated fat
+66%
Contains
less
Sat. FatSaturated fat
-59.3%
Vitamins
Rutabagas are richer in all the vitamins except vitamin B5, which is present in higher amounts in turnips.
300g of rutabaga covers 94% of the DV of vitamin C.
In the diagram below, we can visualize the difference between their vitamin distributions.
Vitamin Comparison
Contains
more
Vitamin CVitamin C
+19%
Contains
more
Vitamin EVitamin E
+900%
Contains
more
Vitamin B1Vitamin B1
+125%
Contains
more
Vitamin B2Vitamin B2
+33.3%
Contains
more
Vitamin B3Vitamin B3
+75%
Contains
more
Vitamin KVitamin K
+200%
Contains
more
FolateFolate
+40%
Contains
more
Vitamin B5Vitamin B5
+25%
Minerals
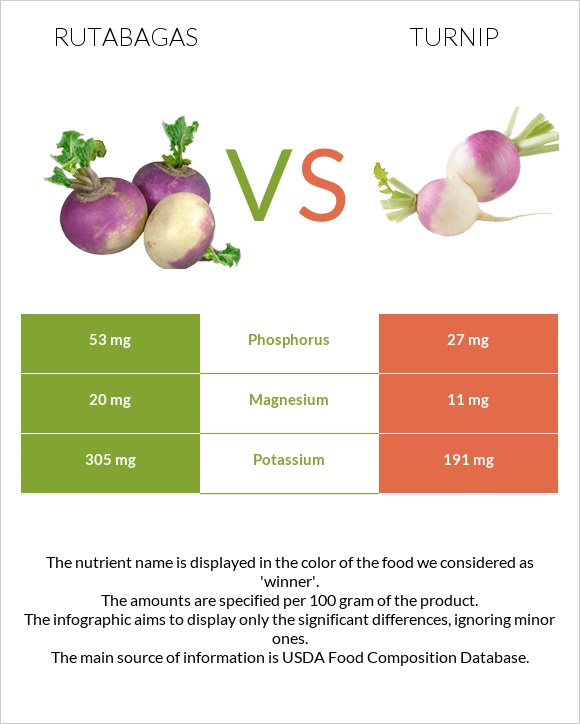
Rutabagas are richer in phosphorus, calcium, iron, magnesium, and potassium. In comparison, turnips are richer in zinc and copper.
In the diagram below, we can visualize the difference between their mineral distributions.
Mineral Comparison
Contains
more
MagnesiumMagnesium
+81.8%
Contains
more
CalciumCalcium
+43.3%
Contains
more
PotassiumPotassium
+59.7%
Contains
more
IronIron
+46.7%
Contains
more
PhosphorusPhosphorus
+96.3%
Contains
less
SodiumSodium
-82.1%
Contains
more
CopperCopper
+165.6%
Contains
more
ZincZinc
+12.5%
Calories
They are low-calorie foods; their minor difference is not significant.
Glycemic Index
Both are classified as high glycemic index foods. Rutabagas have a glycemic index of 72, whereas turnips have a glycemic index of 73.
Health Impact
Turnips and rutabagas are similar to one another. They impact health quite similarly. However, turnips and rutabagas often impact some health conditions with the different compounds they contain.
Diabetes
Blood sugar control is crucial for diabetes management. Turnips are reportedly beneficial for diabetes. A study shows that turnip extract may lower blood glucose levels and increase insulin levels (1). Turnip leaf extract can be beneficial not only for sugar control but lower LDL cholesterol and triglyceride levels (2). You should consider that these are animal studies, and human studies are needed to confirm these results.
Cancer
Turnips and rutabagas contain glucosinolates - chemicals that have significant anticancer properties. Rutabaga consumption reduces prostate and colorectal cancer risk (3) (4).
Turnips are richer in antioxidants called anthocyanins. They are beneficial in lowering breast cancer risk (5) (6).
Bowel Health
Being high in insoluble fiber, rutabagas may be beneficial for bowel health, promoting regular and softer stool production and bowel movements. This type of fiber is also used by the gut microbiome (7).
Inflammation
Turnips contain a chemical called arvelexin. This is an interesting compound that blocks the inflammation pathway in the human colon cells, as a study indicates (8). It blocks nitric oxide, which is a very harmful compound involved in inflammation and cell death (9) (10).
Cardiovascular Health
Rutabagas are rich in potassium, which helps regulate blood pressure. They also contain glucosinolates, compounds known for reducing inflammation and oxidative stress, potentially lowering the risk of cardiovascular issues (11).
Additionally, rutabagas are a good source of fiber, which can aid in lowering cholesterol and enhancing heart health. On the other hand, turnips provide antioxidants that fight free radicals and are high in folate, which can help reduce homocysteine levels, further decreasing cardiovascular risk. Like rutabagas, turnips also contain fiber that supports cholesterol management (12).
Both vegetables contribute to cardiovascular health, with rutabagas particularly effective in blood pressure regulation and turnips playing a key role in antioxidant defense. However, further research is necessary to provide comprehensive and updated evidence regarding their cardiovascular effects.
References
- https://www.ncbi.nlm.nih.gov/pmc/articles/PMC4800080/
- https://www.ncbi.nlm.nih.gov/pmc/articles/PMC4418064/
- https://pubmed.ncbi.nlm.nih.gov/23211939/
- https://pubmed.ncbi.nlm.nih.gov/22121852/
- https://pubmed.ncbi.nlm.nih.gov/30561035/
- https://pubmed.ncbi.nlm.nih.gov/23349849/
- https://pubmed.ncbi.nlm.nih.gov/22861801/
- https://pubmed.ncbi.nlm.nih.gov/22794033/
- https://www.ncbi.nlm.nih.gov/pmc/articles/PMC3171867/
- https://pubmed.ncbi.nlm.nih.gov/14726604/
- https://pmc.ncbi.nlm.nih.gov/articles/PMC6029595/
- https://journals.lww.com/jaapa/citation/2005/09000/from_your_physician_assistant.10.aspx

Infographic
All nutrients comparison - raw data values
| Nutrient | |
|
DV% diff. |
| Copper | 0.032mg | 0.085mg | 6% |
| Vitamin C | 25mg | 21mg | 4% |
| Phosphorus | 53mg | 27mg | 4% |
| Vitamin B1 | 0.09mg | 0.04mg | 4% |
| Potassium | 305mg | 191mg | 3% |
| Magnesium | 20mg | 11mg | 2% |
| Iron | 0.44mg | 0.3mg | 2% |
| Fiber | 2.3g | 1.8g | 2% |
| Sodium | 12mg | 67mg | 2% |
| Vitamin E | 0.3mg | 0.03mg | 2% |
| Vitamin B3 | 0.7mg | 0.4mg | 2% |
| Folate | 21µg | 15µg | 2% |
| Fructose | 1.61g | 2% | |
| Carbs | 8.62g | 6.43g | 1% |
| Calcium | 43mg | 30mg | 1% |
| Vitamin B2 | 0.04mg | 0.03mg | 1% |
| Vitamin B5 | 0.16mg | 0.2mg | 1% |
| Vitamin B6 | 0.1mg | 0.09mg | 1% |
| Choline | 14.1mg | 11.1mg | 1% |
| Calories | 37kcal | 28kcal | 0% |
| Protein | 1.08g | 0.9g | 0% |
| Protein per 100 calories | 2.9g | 3.2g | N/A |
| Calories per 10 g protein | 343kcal | 311kcal | N/A |
| Weight per 100 calories | 270g | 357g | N/A |
| Fats | 0.16g | 0.1g | 0% |
| Net carbs | 6.32g | 4.63g | N/A |
| Sugar | 4.46g | 3.8g | N/A |
| Zinc | 0.24mg | 0.27mg | 0% |
| Starch | 0.4g | 0% | |
| Manganese | 0.131mg | 0.134mg | 0% |
| Selenium | 0.7µg | 0.7µg | 0% |
| Vitamin K | 0.3µg | 0.1µg | 0% |
| Saturated fat | 0.027g | 0.011g | 0% |
| Monounsaturated fat | 0.025g | 0.006g | 0% |
| Polyunsaturated fat | 0.088g | 0.053g | 0% |
| Tryptophan | 0.009mg | 0% | |
| Threonine | 0.025mg | 0% | |
| Isoleucine | 0.036mg | 0% | |
| Leucine | 0.033mg | 0% | |
| Lysine | 0.036mg | 0% | |
| Methionine | 0.011mg | 0% | |
| Phenylalanine | 0.017mg | 0% | |
| Valine | 0.03mg | 0% | |
| Histidine | 0.014mg | 0% |
People also compare


References
All the values for which the sources are not specified explicitly are taken from FDA’s Food Central. The exact link to the food presented on this page can be found below.
- Rutabagas - https://fdc.nal.usda.gov/fdc-app.html#/food-details/168454/nutrients
- Turnip - https://fdc.nal.usda.gov/fdc-app.html#/food-details/170465/nutrients
All the Daily Values are presented for males aged 31-50, for 2000-calorie diets.