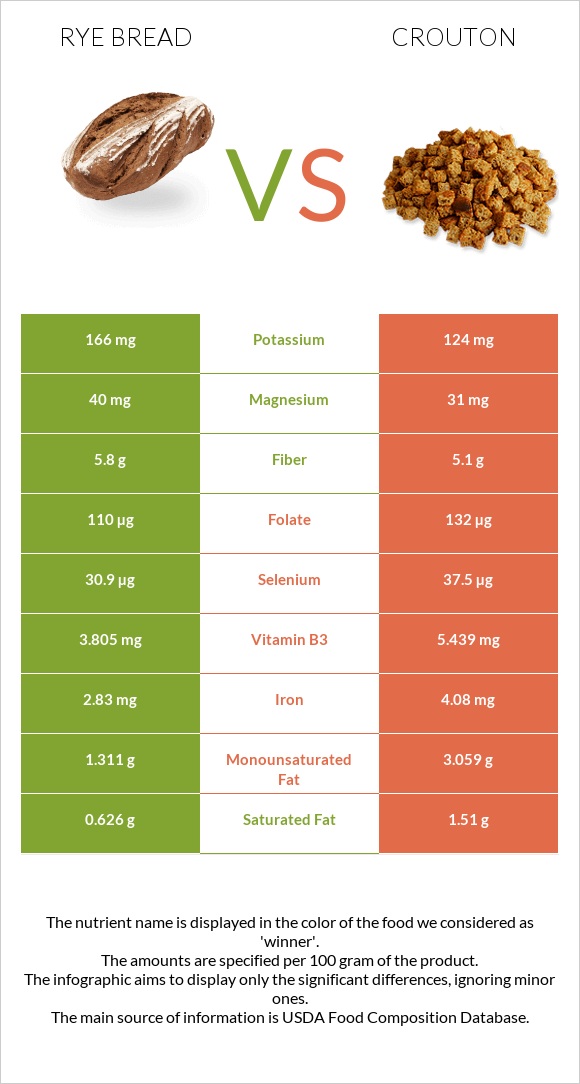
Important differences between rye bread and crouton Rye bread has more manganese; however, crouton is richer in vitamin B1, iron, selenium, vitamin B3, and folate. Crouton's daily need coverage for vitamin B1 is 16% more. Rye bread contains 2 times more manganese than crouton. Rye bread contains 0.824mg of manganese, while crouton contains 0.5mg. Rye bread contains less saturated fat. Crouton has a higher glycemic index. The glycemic index of crouton is 72, while the glycemic index of rye bread is 60. The food varieties used in the comparison are Bread, rye and Croutons, plain .
Infographic
Mineral Comparison
Mineral comparison score is based on the number of minerals by which one or the other food is richer. The "coverage" charts below show how much of the daily needs can be covered by 300 grams of the food.
6
100 g
300 g
1 slice, snack-size - 7g 1 slice, thin - 25g 1 oz - 28.35g 1 slice, regular - 32g
Magnesium
Magnesium
Calcium
Calcium
Potassium
Potassium
Iron
Iron
Copper
Copper
Zinc
Zinc
Phosphorus
Phosphorus
Sodium
Sodium
Manganese
Manganese
Selenium
Selenium
29%
22%
15%
106%
62%
31%
54%
79%
107%
169%
2
100 g
300 g
0.5 oz - 14.2g 1 cup - 30g
Magnesium
Magnesium
Calcium
Calcium
Potassium
Potassium
Iron
Iron
Copper
Copper
Zinc
Zinc
Phosphorus
Phosphorus
Sodium
Sodium
Manganese
Manganese
Selenium
Selenium
22%
23%
11%
153%
54%
24%
49%
91%
65%
205%
Vitamin Comparison
Vitamin comparison score is based on the number of vitamins by which one or the other food is richer. The "coverage" charts below show how much of the daily needs can be covered by 300 grams of the food.
5
100 g
300 g
1 slice, snack-size - 7g 1 slice, thin - 25g 1 oz - 28.35g 1 slice, regular - 32g
Vitamin C
Vit. C
Vitamin D
Vit. D
Vitamin A
Vit. A
Vitamin E
Vit. E
Vitamin B1
Vit. B1
Vitamin B2
Vit. B2
Vitamin B3
Vit. B3
Vitamin B5
Vit. B5
Vitamin B6
Vit. B6
Vitamin B12
Vit. B12
Vitamin K
Vit. K
Folate
Folate
1.3%
0%
0%
6.6%
109%
77%
71%
26%
17%
0%
3%
83%
3
100 g
300 g
0.5 oz - 14.2g 1 cup - 30g
Vitamin C
Vit. C
Vitamin D
Vit. D
Vitamin A
Vit. A
Vitamin E
Vit. E
Vitamin B1
Vit. B1
Vitamin B2
Vit. B2
Vitamin B3
Vit. B3
Vitamin B5
Vit. B5
Vitamin B6
Vit. B6
Vitamin B12
Vit. B12
Vitamin K
Vit. K
Folate
Folate
0%
0%
0%
0%
156%
63%
102%
26%
6%
0%
0%
99%
All nutrients comparison - raw data values
Nutrient
DV% diff.
Iron
2.83mg
4.08mg
16%
Vitamin B1
0.434mg
0.623mg
16%
Manganese
0.824mg
0.5mg
14%
Selenium
30.9µg
37.5µg
12%
Vitamin B3
3.805mg
5.439mg
10%
Carbs
48.3g
73.5g
8%
Calories
259kcal
407kcal
7%
Protein
8.5g
11.9g
7%
Folate
110µg
132µg
6%
Fats
3.3g
6.6g
5%
Vitamin B2
0.335mg
0.272mg
5%
Sodium
603mg
698mg
4%
Vitamin B6
0.075mg
0.026mg
4%
Saturated fat
0.626g
1.51g
4%
Monounsaturated fat
1.311g
3.059g
4%
Fiber
5.8g
5.1g
3%
Copper
0.186mg
0.163mg
3%
Choline
14.6mg
3%
Polyunsaturated fat
0.799g
1.273g
3%
Magnesium
40mg
31mg
2%
Zinc
1.14mg
0.89mg
2%
Vitamin E
0.33mg
2%
Potassium
166mg
124mg
1%
Phosphorus
125mg
115mg
1%
Vitamin K
1.2µg
1%
Protein per 100 calories
3.3g
2.9g
N/A
Calories per 10 g protein
305kcal
342kcal
N/A
Weight per 100 calories
39g
25g
N/A
Unsaturated / Saturated Fat ratio
3.4
2.9
N/A
Vitamin C
0.4mg
0mg
0%
Net carbs
42.5g
68.4g
N/A
Calcium
73mg
76mg
0%
Sugar
3.85g
N/A
Vitamin B5
0.44mg
0.429mg
0%
Tryptophan
0.096mg
0.14mg
0%
Threonine
0.255mg
0.337mg
0%
Isoleucine
0.319mg
0.456mg
0%
Leucine
0.579mg
0.832mg
0%
Lysine
0.233mg
0.278mg
0%
Methionine
0.139mg
0.211mg
0%
Phenylalanine
0.411mg
0.586mg
0%
Valine
0.379mg
0.514mg
0%
Histidine
0.182mg
0.255mg
0%
Macronutrient Comparison
Macronutrient breakdown side-by-side comparison
2
9%
3%
48%
37%
3%
Protein:
8.5 g
Fats:
3.3 g
Carbs:
48.3 g
Water:
37.3 g
Other:
2.6 g
3
12%
7%
74%
6%
3%
Protein:
11.9 g
Fats:
6.6 g
Carbs:
73.5 g
Water:
5.5 g
Other:
2.5 g
Contains
more
Water Water
+578.2%
Contains
more
Protein Protein
+40%
Contains
more
Fats Fats
+100%
Contains
more
Carbs Carbs
+52.2%
Fat Type Comparison
Fat type breakdown side-by-side comparison
1
23%
48%
29%
Saturated fat:
Sat. Fat
0.626 g
Monounsaturated fat:
Mono. Fat
1.311 g
Polyunsaturated fat:
Poly. Fat
0.799 g
2
26%
52%
22%
Saturated fat:
Sat. Fat
1.51 g
Monounsaturated fat:
Mono. Fat
3.059 g
Polyunsaturated fat:
Poly. Fat
1.273 g
Contains
less
Sat. Fat Saturated fat
-58.5%
Contains
more
Mono. Fat Monounsaturated fat
+133.3%
Contains
more
Poly. Fat Polyunsaturated fat
+59.3%