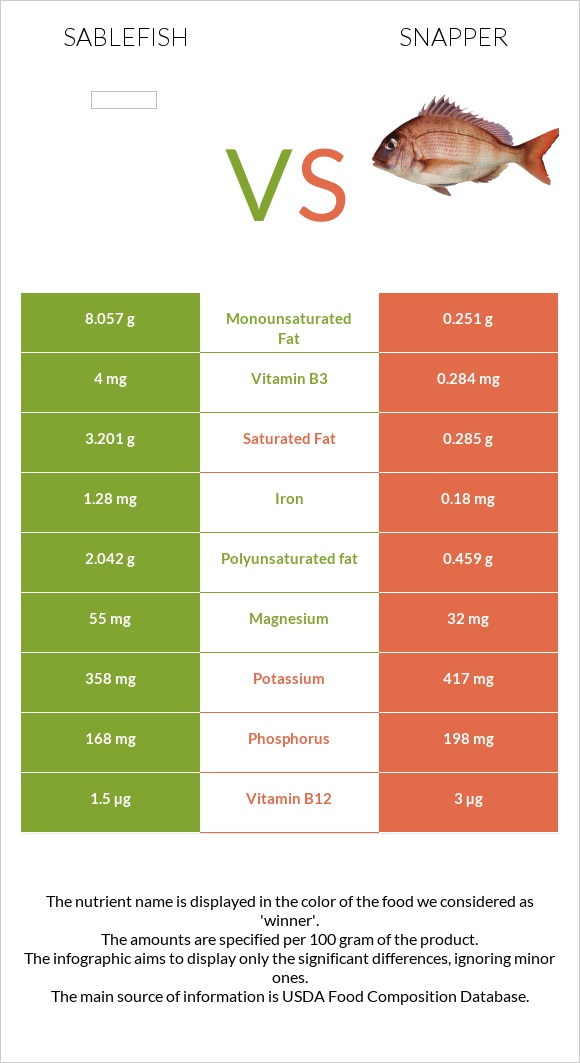
Significant differences between sablefish and snapper Sablefish has more vitamin B3, iron, vitamin B2, magnesium, and vitamin B1; however, snapper is richer in vitamin B12 and vitamin B6. Snapper covers your daily vitamin B12 needs 86% more than sablefish. Snapper has 29 times less vitamin B2 than sablefish. Sablefish has 0.115mg of vitamin B2, while snapper has 0.004mg. Snapper contains less saturated fat. Specific food types used in this comparison are Fish, sablefish, cooked, dry heat and Fish, snapper, mixed species, cooked, dry heat .
Infographic
Mineral Comparison
Mineral comparison score is based on the number of minerals by which one or the other food is richer. The "coverage" charts below show how much of the daily needs can be covered by 300 grams of the food.
4
100 g
300 g
3 oz - 85g 0.5 fillet - 151g
Magnesium
Magnesium
Calcium
Calcium
Potassium
Potassium
Iron
Iron
Copper
Copper
Zinc
Zinc
Phosphorus
Phosphorus
Sodium
Sodium
Manganese
Manganese
Selenium
Selenium
51%
14%
41%
62%
9.3%
11%
92%
9.4%
2.5%
255%
3
100 g
300 g
3 oz - 85g 1 fillet - 170g
Magnesium
Magnesium
Calcium
Calcium
Potassium
Potassium
Iron
Iron
Copper
Copper
Zinc
Zinc
Phosphorus
Phosphorus
Sodium
Sodium
Manganese
Manganese
Selenium
Selenium
26%
12%
46%
9%
15%
12%
86%
7.4%
2.2%
267%
Vitamin Comparison
Vitamin comparison score is based on the number of vitamins by which one or the other food is richer. The "coverage" charts below show how much of the daily needs can be covered by 300 grams of the food.
5
100 g
300 g
3 oz - 85g 0.5 fillet - 151g
Vitamin C
Vit. C
Vitamin D
Vit. D
Vitamin A
Vit. A
Vitamin E
Vit. E
Vitamin B1
Vit. B1
Vitamin B2
Vit. B2
Vitamin B3
Vit. B3
Vitamin B5
Vit. B5
Vitamin B6
Vit. B6
Vitamin B12
Vit. B12
Vitamin K
Vit. K
Folate
Folate
0%
0%
34%
0%
31%
27%
96%
52%
80%
180%
0%
13%
3
100 g
300 g
3 oz - 85g 1 fillet - 170g
Vitamin C
Vit. C
Vitamin D
Vit. D
Vitamin A
Vit. A
Vitamin E
Vit. E
Vitamin B1
Vit. B1
Vitamin B2
Vit. B2
Vitamin B3
Vit. B3
Vitamin B5
Vit. B5
Vitamin B6
Vit. B6
Vitamin B12
Vit. B12
Vitamin K
Vit. K
Folate
Folate
5.3%
0%
12%
0%
13%
0.92%
6.5%
52%
106%
438%
0%
4.5%
All nutrients comparison - raw data values
Nutrient
DV% diff.
Vitamin B12
1.44µg
3.5µg
86%
Vitamin B3
5.128mg
0.346mg
30%
Fats
19.62g
1.72g
28%
Monounsaturated fat
10.328g
0.322g
25%
Protein
17.19g
26.3g
18%
Iron
1.64mg
0.24mg
18%
Saturated fat
4.099g
0.365g
17%
Polyunsaturated fat
2.618g
0.588g
14%
Vitamin B2
0.115mg
0.004mg
9%
Vitamin B6
0.346mg
0.46mg
9%
Magnesium
71mg
37mg
8%
Vitamin A
102µg
35µg
7%
Calories
250kcal
128kcal
6%
Vitamin B1
0.122mg
0.053mg
6%
Cholesterol
63mg
47mg
5%
Selenium
46.8µg
49µg
4%
Folate
17µg
6µg
3%
Vitamin C
0mg
1.6mg
2%
Potassium
459mg
522mg
2%
Copper
0.028mg
0.046mg
2%
Phosphorus
215mg
201mg
2%
Calcium
45mg
40mg
1%
Sodium
72mg
57mg
1%
Protein per 100 calories
6.9g
21g
N/A
Calories per 10 g protein
145kcal
49kcal
N/A
Weight per 100 calories
40g
78g
N/A
Unsaturated / Saturated Fat ratio
3.2
2.5
N/A
Zinc
0.41mg
0.44mg
0%
Manganese
0.019mg
0.017mg
0%
Vitamin B5
0.865mg
0.87mg
0%
Tryptophan
0.193mg
0.294mg
0%
Threonine
0.754mg
1.153mg
0%
Isoleucine
0.792mg
1.212mg
0%
Leucine
1.397mg
2.137mg
0%
Lysine
1.579mg
2.415mg
0%
Methionine
0.509mg
0.778mg
0%
Phenylalanine
0.671mg
1.027mg
0%
Valine
0.886mg
1.355mg
0%
Histidine
0.506mg
0.774mg
0%
Omega-3 - EPA
0.867g
0.048g
N/A
Omega-3 - DHA
0.92g
0.273g
N/A
Omega-3 - DPA
0.216g
0.022g
N/A
Macronutrient Comparison
Macronutrient breakdown side-by-side comparison
1
17%
20%
63%
Protein:
17.19 g
Fats:
19.62 g
Carbs:
0 g
Water:
62.85 g
Other:
0.34 g
3
26%
2%
70%
Protein:
26.3 g
Fats:
1.72 g
Carbs:
0 g
Water:
70.35 g
Other:
1.63 g
Contains
more
Fats Fats
+1040.7%
Contains
more
Protein Protein
+53%
Contains
more
Water Water
+11.9%
Contains
more
Other Other
+379.4%
Fat Type Comparison
Fat type breakdown side-by-side comparison
2
24%
61%
15%
Saturated fat:
Sat. Fat
4.099 g
Monounsaturated fat:
Mono. Fat
10.328 g
Polyunsaturated fat:
Poly. Fat
2.618 g
1
29%
25%
46%
Saturated fat:
Sat. Fat
0.365 g
Monounsaturated fat:
Mono. Fat
0.322 g
Polyunsaturated fat:
Poly. Fat
0.588 g
Contains
more
Mono. Fat Monounsaturated fat
+3107.5%
Contains
more
Poly. Fat Polyunsaturated fat
+345.2%
Contains
less
Sat. Fat Saturated fat
-91.1%