Safflower vs. Chicken fingers — In-Depth Nutrition Comparison
Compare
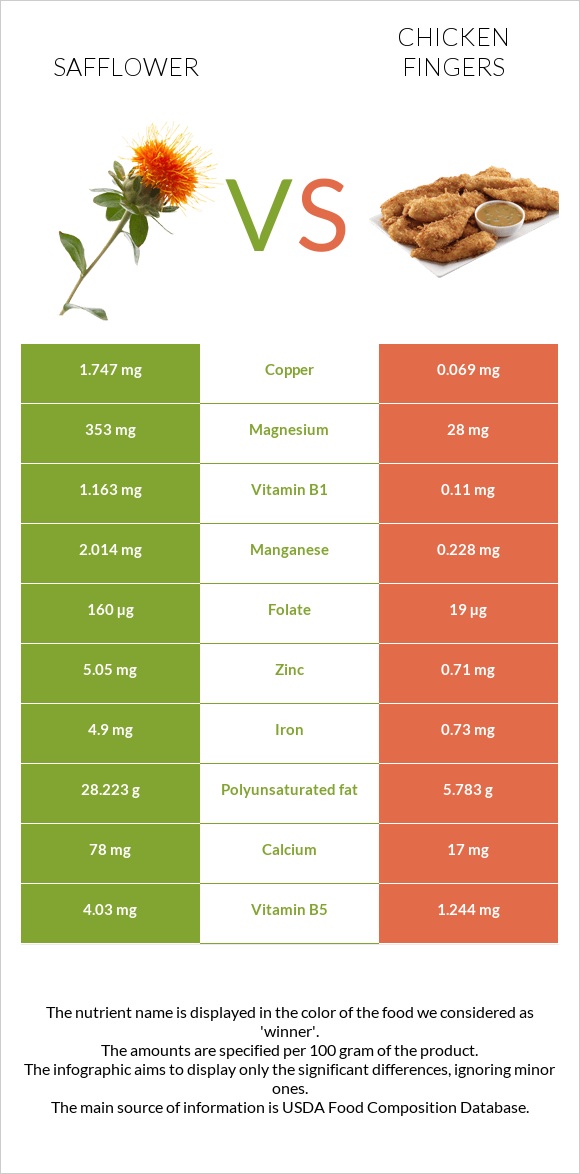
Important differences between safflower and chicken fingers
- Safflower has more copper, vitamin B1, manganese, magnesium, vitamin B6, vitamin B5, iron, phosphorus, and zinc; however, chicken fingers are richer in vitamin B3.
- Safflower's daily need coverage for copper is 186% more.
- Safflower contains 13 times more magnesium than chicken fingers. Safflower contains 353mg of magnesium, while chicken fingers contain 28mg.
The food varieties used in the comparison are Seeds, safflower seed kernels, dried and Fast foods, chicken tenders.
Infographic
Infographic link
Mineral Comparison
Mineral comparison score is based on the number of minerals by which one or the other food is richer. The "coverage" charts below show how much of the daily needs can be covered by 300 grams of the food.
| Contains more MagnesiumMagnesium | +1160.7% |
| Contains more CalciumCalcium | +358.8% |
| Contains more PotassiumPotassium | +84.2% |
| Contains more IronIron | +571.2% |
| Contains more CopperCopper | +2431.9% |
| Contains more ZincZinc | +611.3% |
| Contains more PhosphorusPhosphorus | +128.4% |
| Contains less SodiumSodium | -99.6% |
| Contains more ManganeseManganese | +783.3% |
Vitamin Comparison
Vitamin comparison score is based on the number of vitamins by which one or the other food is richer. The "coverage" charts below show how much of the daily needs can be covered by 300 grams of the food.
| Contains more Vitamin B1Vitamin B1 | +957.3% |
| Contains more Vitamin B2Vitamin B2 | +131.8% |
| Contains more Vitamin B5Vitamin B5 | +224% |
| Contains more Vitamin B6Vitamin B6 | +174.6% |
| Contains more FolateFolate | +742.1% |
| Contains more Vitamin CVitamin C | +∞% |
| Contains more Vitamin DVitamin D | +∞% |
| Contains more Vitamin B3Vitamin B3 | +259.8% |
| Contains more Vitamin B12Vitamin B12 | +∞% |
All nutrients comparison - raw data values
| Nutrient |  |
 |
DV% diff. |
| Copper | 1.747mg | 0.069mg | 186% |
| Polyunsaturated fat | 28.223g | 5.783g | 150% |
| Vitamin B1 | 1.163mg | 0.11mg | 88% |
| Manganese | 2.014mg | 0.228mg | 78% |
| Magnesium | 353mg | 28mg | 77% |
| Vitamin B6 | 1.17mg | 0.426mg | 57% |
| Vitamin B5 | 4.03mg | 1.244mg | 56% |
| Iron | 4.9mg | 0.73mg | 52% |
| Phosphorus | 644mg | 282mg | 52% |
| Zinc | 5.05mg | 0.71mg | 39% |
| Fats | 38.45g | 13.95g | 38% |
| Vitamin B3 | 2.284mg | 8.217mg | 37% |
| Folate | 160µg | 19µg | 35% |
| Sodium | 3mg | 769mg | 33% |
| Selenium | 17.5µg | 32% | |
| Vitamin E | 3.17mg | 21% | |
| Vitamin B2 | 0.415mg | 0.179mg | 18% |
| Cholesterol | 0mg | 48mg | 16% |
| Calories | 517kcal | 271kcal | 12% |
| Potassium | 687mg | 373mg | 9% |
| Choline | 43.7mg | 8% | |
| Starch | 17.03g | 7% | |
| Vitamin B12 | 0µg | 0.16µg | 7% |
| Vitamin K | 8µg | 7% | |
| Protein | 16.18g | 19.22g | 6% |
| Carbs | 34.29g | 17.25g | 6% |
| Calcium | 78mg | 17mg | 6% |
| Fiber | 1.2g | 5% | |
| Saturated fat | 3.682g | 2.493g | 5% |
| Vitamin C | 0mg | 1.1mg | 1% |
| Vitamin D | 0 IU | 7 IU | 1% |
| Vitamin D | 0µg | 0.2µg | 1% |
| Net carbs | 34.29g | 16.05g | N/A |
| Sugar | 0.4g | N/A | |
| Vitamin A | 3µg | 3µg | 0% |
| Trans fat | 0.052g | N/A | |
| Monounsaturated fat | 4.848g | 4.83g | 0% |
| Tryptophan | 0.183mg | 0.222mg | 0% |
| Threonine | 0.586mg | 0.803mg | 0% |
| Isoleucine | 0.717mg | 0.845mg | 0% |
| Leucine | 1.154mg | 1.553mg | 0% |
| Lysine | 0.534mg | 1.616mg | 0% |
| Methionine | 0.284mg | 0.518mg | 0% |
| Phenylalanine | 0.806mg | 1.437mg | 0% |
| Valine | 1.025mg | 0.908mg | 0% |
| Histidine | 0.452mg | 0.655mg | 0% |
| Omega-3 - DHA | 0.002g | N/A | |
| Omega-3 - ALA | 0.211g | N/A | |
| Omega-3 - DPA | 0.003g | N/A | |
| Omega-6 - Gamma-linoleic acid | 0.015g | N/A | |
| Omega-6 - Dihomo-gamma-linoleic acid | 0.008g | N/A | |
| Omega-6 - Eicosadienoic acid | 0.007g | N/A | |
| Omega-6 - Linoleic acid | 5.439g | N/A |
Macronutrient Comparison
Macronutrient breakdown side-by-side comparison
Protein:
16.18 g
Fats:
38.45 g
Carbs:
34.29 g
Water:
5.62 g
Other:
5.46 g
Protein:
19.22 g
Fats:
13.95 g
Carbs:
17.25 g
Water:
46.64 g
Other:
2.94 g
| Contains more FatsFats | +175.6% |
| Contains more CarbsCarbs | +98.8% |
| Contains more OtherOther | +85.7% |
| Contains more ProteinProtein | +18.8% |
| Contains more WaterWater | +729.9% |
Fat Type Comparison
Fat type breakdown side-by-side comparison
Saturated fat:
Sat. Fat
3.682 g
Monounsaturated fat:
Mono. Fat
4.848 g
Polyunsaturated fat:
Poly. Fat
28.223 g
Saturated fat:
Sat. Fat
2.493 g
Monounsaturated fat:
Mono. Fat
4.83 g
Polyunsaturated fat:
Poly. Fat
5.783 g
| Contains more Poly. FatPolyunsaturated fat | +388% |
| Contains less Sat. FatSaturated fat | -32.3% |
~equal in
Monounsaturated fat
~4.83g


