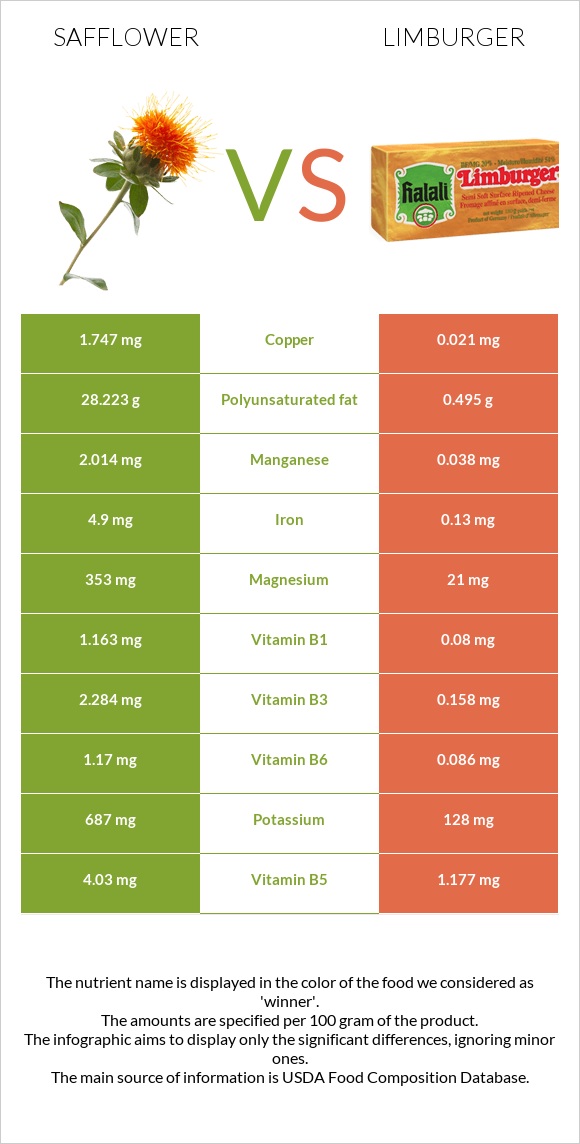
A recap on the differences between safflower and Limburger Safflower has more copper, vitamin B1, manganese, vitamin B6, magnesium, iron, and vitamin B5; however, Limburger is higher in vitamin B12 and calcium. Safflower covers your daily copper needs 192% more than Limburger. Limburger contains 53 times less manganese than safflower. Safflower contains 2.014mg of manganese, while Limburger contains 0.038mg. Safflower has less saturated fat. Food varieties used in this article are Seeds, safflower seed kernels, dried and Cheese, limburger .
Infographic
Mineral Comparison
Mineral comparison score is based on the number of minerals by which one or the other food is richer. The "coverage" charts below show how much of the daily needs can be covered by 300 grams of the food.
8
100 g
300 g
1 oz - 28.35g
Magnesium
Magnesium
Calcium
Calcium
Potassium
Potassium
Iron
Iron
Copper
Copper
Zinc
Zinc
Phosphorus
Phosphorus
Sodium
Sodium
Manganese
Manganese
Selenium
Selenium
252%
23%
61%
184%
582%
138%
276%
0.39%
263%
0%
2
100 g
300 g
1 cubic inch - 18g 1 oz - 28.35g 1 box - 113g 1 cup - 134g 1 package (8 oz) - 227g
Magnesium
Magnesium
Calcium
Calcium
Potassium
Potassium
Iron
Iron
Copper
Copper
Zinc
Zinc
Phosphorus
Phosphorus
Sodium
Sodium
Manganese
Manganese
Selenium
Selenium
15%
149%
11%
4.9%
7%
57%
168%
104%
5%
79%
Vitamin Comparison
Vitamin comparison score is based on the number of vitamins by which one or the other food is richer. The "coverage" charts below show how much of the daily needs can be covered by 300 grams of the food.
5
100 g
300 g
1 oz - 28.35g
Vitamin C
Vit. C
Vitamin D
Vit. D
Vitamin A
Vit. A
Vitamin E
Vit. E
Vitamin B1
Vit. B1
Vitamin B2
Vit. B2
Vitamin B3
Vit. B3
Vitamin B5
Vit. B5
Vitamin B6
Vit. B6
Vitamin B12
Vit. B12
Vitamin K
Vit. K
Folate
Folate
0%
0%
1%
0%
291%
96%
43%
242%
270%
0%
0%
120%
6
100 g
300 g
1 cubic inch - 18g 1 oz - 28.35g 1 box - 113g 1 cup - 134g 1 package (8 oz) - 227g
Vitamin C
Vit. C
Vitamin D
Vit. D
Vitamin A
Vit. A
Vitamin E
Vit. E
Vitamin B1
Vit. B1
Vitamin B2
Vit. B2
Vitamin B3
Vit. B3
Vitamin B5
Vit. B5
Vitamin B6
Vit. B6
Vitamin B12
Vit. B12
Vitamin K
Vit. K
Folate
Folate
0%
7.5%
113%
4.6%
20%
116%
3%
71%
20%
130%
5.8%
44%
All nutrients comparison - raw data values
Nutrient
DV% diff.
Copper
1.747mg
0.021mg
192%
Polyunsaturated fat
28.223g
0.495g
185%
Vitamin B1
1.163mg
0.08mg
90%
Manganese
2.014mg
0.038mg
86%
Vitamin B6
1.17mg
0.086mg
83%
Magnesium
353mg
21mg
79%
Iron
4.9mg
0.13mg
60%
Saturated fat
3.682g
16.746g
59%
Vitamin B5
4.03mg
1.177mg
57%
Vitamin B12
0µg
1.04µg
43%
Calcium
78mg
497mg
42%
Vitamin A
3µg
340µg
37%
Phosphorus
644mg
393mg
36%
Sodium
3mg
800mg
35%
Cholesterol
0mg
90mg
30%
Zinc
5.05mg
2.1mg
27%
Selenium
14.5µg
26%
Folate
160µg
58µg
26%
Fats
38.45g
27.25g
17%
Potassium
687mg
128mg
16%
Vitamin B3
2.284mg
0.158mg
13%
Carbs
34.29g
0.49g
11%
Calories
517kcal
327kcal
10%
Monounsaturated fat
4.848g
8.606g
9%
Protein
16.18g
20.05g
8%
Vitamin B2
0.415mg
0.503mg
7%
Vitamin D*
0 IU
20 IU
3%
Vitamin D
0µg
0.5µg
3%
Choline
15.4mg
3%
Vitamin E
0.23mg
2%
Vitamin K
2.3µg
2%
Protein per 100 calories
3.1g
6.1g
N/A
Calories per 10 g protein
320kcal
163kcal
N/A
Weight per 100 calories
19g
31g
N/A
Unsaturated / Saturated Fat ratio
9
0.54
N/A
Net carbs
34.29g
0.49g
N/A
Sugar
0.49g
N/A
Tryptophan
0.183mg
0.289mg
0%
Threonine
0.586mg
0.739mg
0%
Isoleucine
0.717mg
1.219mg
0%
Leucine
1.154mg
2.093mg
0%
Lysine
0.534mg
1.675mg
0%
Methionine
0.284mg
0.619mg
0%
Phenylalanine
0.806mg
1.116mg
0%
Valine
1.025mg
1.439mg
0%
Histidine
0.452mg
0.578mg
0%
Macronutrient Comparison
Macronutrient breakdown side-by-side comparison
3
16%
38%
34%
6%
5%
Protein:
16.18 g
Fats:
38.45 g
Carbs:
34.29 g
Water:
5.62 g
Other:
5.46 g
2
20%
27%
48%
4%
Protein:
20.05 g
Fats:
27.25 g
Carbs:
0.49 g
Water:
48.42 g
Other:
3.79 g
Contains
more
Fats Fats
+41.1%
Contains
more
Carbs Carbs
+6898%
Contains
more
Other Other
+44.1%
Contains
more
Protein Protein
+23.9%
Contains
more
Water Water
+761.6%
Fat Type Comparison
Fat type breakdown side-by-side comparison
2
10%
13%
77%
Saturated fat:
Sat. Fat
3.682 g
Monounsaturated fat:
Mono. Fat
4.848 g
Polyunsaturated fat:
Poly. Fat
28.223 g
1
65%
33%
2%
Saturated fat:
Sat. Fat
16.746 g
Monounsaturated fat:
Mono. Fat
8.606 g
Polyunsaturated fat:
Poly. Fat
0.495 g
Contains
less
Sat. Fat Saturated fat
-78%
Contains
more
Poly. Fat Polyunsaturated fat
+5601.6%
Contains
more
Mono. Fat Monounsaturated fat
+77.5%