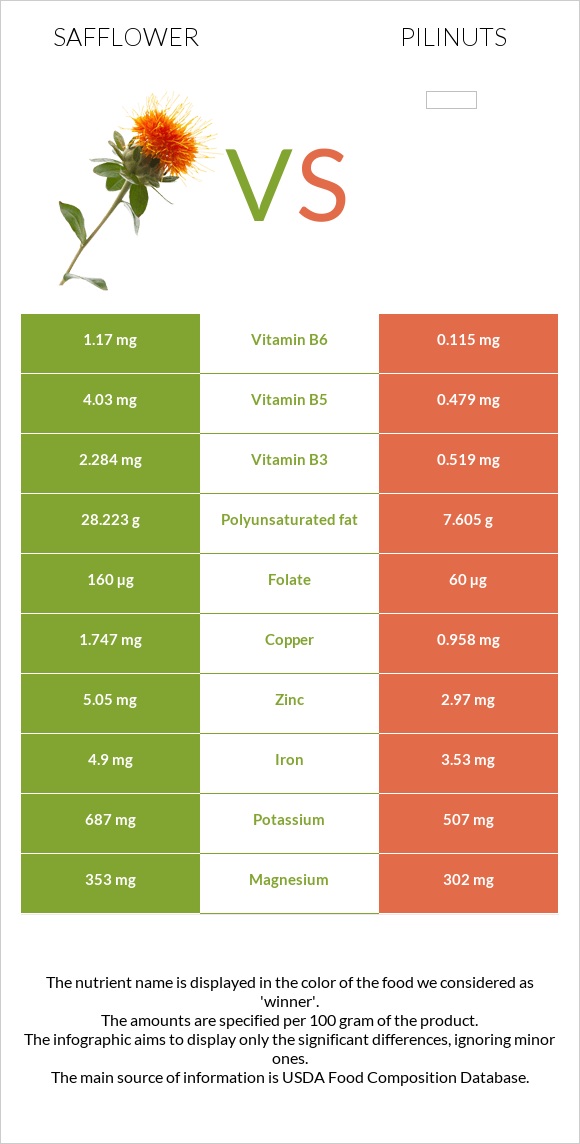
What are the main differences between safflower and pili nuts? Safflower is richer in copper, vitamin B6, vitamin B5, folate, vitamin B2, vitamin B1, zinc, and iron, yet pili nuts are richer in manganese. Pili nuts' daily need coverage for saturated fat is 138% higher. Safflower has 10 times more vitamin B6 than pili nuts. Safflower has 1.17mg of vitamin B6, while pili nuts have 0.115mg. Safflower contains less saturated fat. We used Seeds, safflower seed kernels, dried and Nuts, pilinuts, dried types in this comparison.
Infographic
Mineral Comparison
Mineral comparison score is based on the number of minerals by which one or the other food is richer. The "coverage" charts below show how much of the daily needs can be covered by 300 grams of the food.
6
100 g
300 g
1 oz - 28.35g
Magnesium
Magnesium
Calcium
Calcium
Potassium
Potassium
Iron
Iron
Copper
Copper
Zinc
Zinc
Phosphorus
Phosphorus
Sodium
Sodium
Manganese
Manganese
Selenium
Selenium
252%
23%
61%
184%
582%
138%
276%
0.39%
263%
0%
2
100 g
300 g
1 oz (15 kernels) - 28.35g 1 cup - 120g
Magnesium
Magnesium
Calcium
Calcium
Potassium
Potassium
Iron
Iron
Copper
Copper
Zinc
Zinc
Phosphorus
Phosphorus
Sodium
Sodium
Manganese
Manganese
Selenium
Selenium
216%
44%
45%
132%
319%
81%
246%
0.39%
302%
0%
Vitamin Comparison
Vitamin comparison score is based on the number of vitamins by which one or the other food is richer. The "coverage" charts below show how much of the daily needs can be covered by 300 grams of the food.
7
100 g
300 g
1 oz - 28.35g
Vitamin C
Vit. C
Vitamin D
Vit. D
Vitamin A
Vit. A
Vitamin E
Vit. E
Vitamin B1
Vit. B1
Vitamin B2
Vit. B2
Vitamin B3
Vit. B3
Vitamin B5
Vit. B5
Vitamin B6
Vit. B6
Vitamin B12
Vit. B12
Vitamin K
Vit. K
Folate
Folate
0%
0%
1%
0%
291%
96%
43%
242%
270%
0%
0%
120%
1
100 g
300 g
1 oz (15 kernels) - 28.35g 1 cup - 120g
Vitamin C
Vit. C
Vitamin D
Vit. D
Vitamin A
Vit. A
Vitamin E
Vit. E
Vitamin B1
Vit. B1
Vitamin B2
Vit. B2
Vitamin B3
Vit. B3
Vitamin B5
Vit. B5
Vitamin B6
Vit. B6
Vitamin B12
Vit. B12
Vitamin K
Vit. K
Folate
Folate
2%
0%
0.67%
0%
228%
21%
9.7%
29%
27%
0%
0%
45%
All nutrients comparison - raw data values
Nutrient
DV% diff.
Polyunsaturated fat
28.223g
7.605g
137%
Saturated fat
3.682g
31.184g
125%
Copper
1.747mg
0.958mg
88%
Vitamin B6
1.17mg
0.115mg
81%
Monounsaturated fat
4.848g
37.229g
81%
Vitamin B5
4.03mg
0.479mg
71%
Fats
38.45g
79.55g
63%
Vitamin B2
0.415mg
0.093mg
25%
Folate
160µg
60µg
25%
Vitamin B1
1.163mg
0.913mg
21%
Zinc
5.05mg
2.97mg
19%
Iron
4.9mg
3.53mg
17%
Manganese
2.014mg
2.313mg
13%
Magnesium
353mg
302mg
12%
Protein
16.18g
10.8g
11%
Vitamin B3
2.284mg
0.519mg
11%
Calories
517kcal
719kcal
10%
Carbs
34.29g
3.98g
10%
Phosphorus
644mg
575mg
10%
Calcium
78mg
145mg
7%
Potassium
687mg
507mg
5%
Vitamin C
0mg
0.6mg
1%
Protein per 100 calories
3.1g
1.5g
N/A
Calories per 10 g protein
320kcal
666kcal
N/A
Weight per 100 calories
19g
14g
N/A
Unsaturated / Saturated Fat ratio
9
1.4
N/A
Net carbs
34.29g
3.98g
N/A
Sodium
3mg
3mg
0%
Vitamin A
3µg
2µg
0%
Tryptophan
0.183mg
0.189mg
0%
Threonine
0.586mg
0.407mg
0%
Isoleucine
0.717mg
0.483mg
0%
Leucine
1.154mg
0.89mg
0%
Lysine
0.534mg
0.369mg
0%
Methionine
0.284mg
0.395mg
0%
Phenylalanine
0.806mg
0.497mg
0%
Valine
1.025mg
0.701mg
0%
Histidine
0.452mg
0.255mg
0%
Macronutrient Comparison
Macronutrient breakdown side-by-side comparison
4
16%
38%
34%
6%
5%
Protein:
16.18 g
Fats:
38.45 g
Carbs:
34.29 g
Water:
5.62 g
Other:
5.46 g
1
11%
80%
4%
3%
3%
Protein:
10.8 g
Fats:
79.55 g
Carbs:
3.98 g
Water:
2.77 g
Other:
2.9 g
Contains
more
Protein Protein
+49.8%
Contains
more
Carbs Carbs
+761.6%
Contains
more
Water Water
+102.9%
Contains
more
Other Other
+88.3%
Contains
more
Fats Fats
+106.9%
Fat Type Comparison
Fat type breakdown side-by-side comparison
2
10%
13%
77%
Saturated fat:
Sat. Fat
3.682 g
Monounsaturated fat:
Mono. Fat
4.848 g
Polyunsaturated fat:
Poly. Fat
28.223 g
1
41%
49%
10%
Saturated fat:
Sat. Fat
31.184 g
Monounsaturated fat:
Mono. Fat
37.229 g
Polyunsaturated fat:
Poly. Fat
7.605 g
Contains
less
Sat. Fat Saturated fat
-88.2%
Contains
more
Poly. Fat Polyunsaturated fat
+271.1%
Contains
more
Mono. Fat Monounsaturated fat
+667.9%