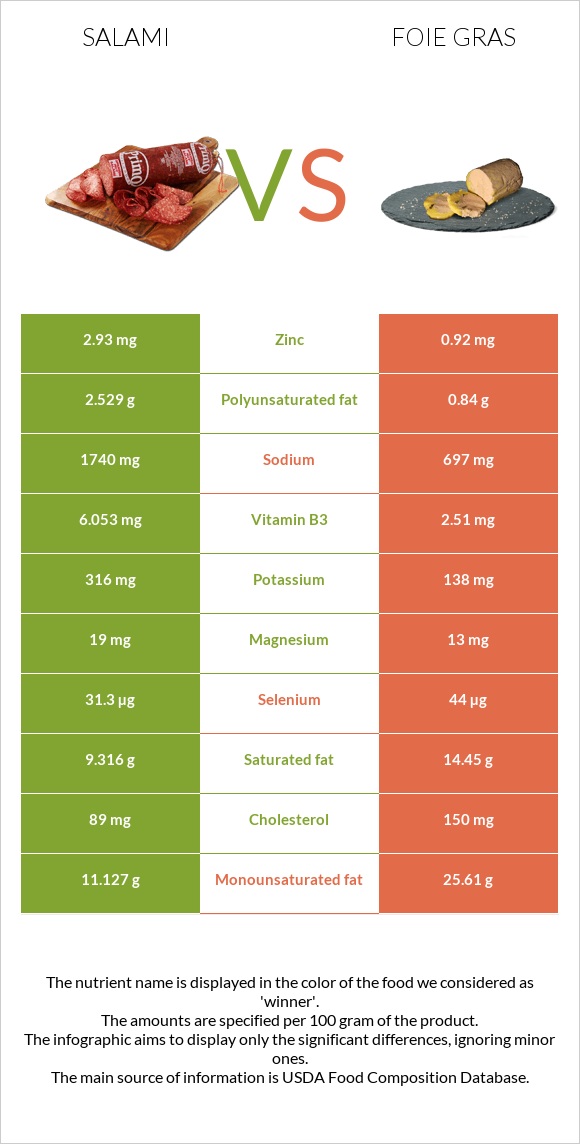
Differences between salami and foie gras Salami has more manganese, vitamin B6, vitamin B1, and vitamin B3, while foie gras has more vitamin B12, vitamin A, iron, and selenium. Foie gras's daily need coverage for vitamin B12 is 328% higher. Foie gras contains 8 times less manganese than salami. Salami contains 0.978mg of manganese, while foie gras contains 0.12mg. The amount of sodium in foie gras is lower. The food types used in this comparison are Salami, cooked, beef, and pork and Pate de foie gras, canned (goose liver pate), smoked .
Infographic
Mineral Comparison
Mineral comparison score is based on the number of minerals by which one or the other food is richer. The "coverage" charts below show how much of the daily needs can be covered by 300 grams of the food.
4
100 g
300 g
1 slice round - 12.3g
Magnesium
Magnesium
Calcium
Calcium
Potassium
Potassium
Iron
Iron
Copper
Copper
Zinc
Zinc
Phosphorus
Phosphorus
Sodium
Sodium
Manganese
Manganese
Selenium
Selenium
14%
4.5%
28%
59%
119%
80%
82%
227%
128%
171%
5
100 g
300 g
1 tbsp - 13g 1 oz - 28.35g
Magnesium
Magnesium
Calcium
Calcium
Potassium
Potassium
Iron
Iron
Copper
Copper
Zinc
Zinc
Phosphorus
Phosphorus
Sodium
Sodium
Manganese
Manganese
Selenium
Selenium
9.3%
21%
12%
206%
133%
25%
86%
91%
16%
240%
Vitamin Comparison
Vitamin comparison score is based on the number of vitamins by which one or the other food is richer. The "coverage" charts below show how much of the daily needs can be covered by 300 grams of the food.
7
100 g
300 g
1 slice round - 12.3g
Vitamin C
Vit. C
Vitamin D
Vit. D
Vitamin A
Vit. A
Vitamin E
Vit. E
Vitamin B1
Vit. B1
Vitamin B2
Vit. B2
Vitamin B3
Vit. B3
Vitamin B5
Vit. B5
Vitamin B6
Vit. B6
Vitamin B12
Vit. B12
Vitamin K
Vit. K
Folate
Folate
0%
15%
0%
4.4%
92%
82%
113%
72%
106%
190%
8%
2.3%
4
100 g
300 g
1 tbsp - 13g 1 oz - 28.35g
Vitamin C
Vit. C
Vitamin D
Vit. D
Vitamin A
Vit. A
Vitamin E
Vit. E
Vitamin B1
Vit. B1
Vitamin B2
Vit. B2
Vitamin B3
Vit. B3
Vitamin B5
Vit. B5
Vitamin B6
Vit. B6
Vitamin B12
Vit. B12
Vitamin K
Vit. K
Folate
Folate
6.7%
0%
334%
0%
22%
69%
47%
72%
14%
1175%
0%
45%
All nutrients comparison - raw data values
Nutrient
DV% diff.
Vitamin B12
1.52µg
9.4µg
328%
Vitamin A
0µg
1001µg
111%
Iron
1.56mg
5.5mg
49%
Sodium
1740mg
697mg
45%
Manganese
0.978mg
0.12mg
37%
Monounsaturated fat
11.127g
25.61g
36%
Vitamin B6
0.459mg
0.06mg
31%
Fats
25.9g
43.84g
28%
Selenium
31.3µg
44µg
23%
Vitamin B1
0.367mg
0.088mg
23%
Saturated fat
9.316g
14.45g
23%
Vitamin B3
6.053mg
2.51mg
22%
Protein
21.85g
11.4g
21%
Cholesterol
89mg
150mg
20%
Zinc
2.93mg
0.92mg
18%
Choline
93.5mg
17%
Folate
3µg
60µg
14%
Polyunsaturated fat
2.529g
0.84g
11%
Calories
336kcal
462kcal
6%
Calcium
15mg
70mg
6%
Vitamin D*
41 IU
5%
Vitamin D
1µg
5%
Potassium
316mg
138mg
5%
Copper
0.357mg
0.4mg
5%
Vitamin B2
0.357mg
0.299mg
4%
Vitamin K
3.2µg
3%
Vitamin C
0mg
2mg
2%
Carbs
2.4g
4.67g
1%
Magnesium
19mg
13mg
1%
Phosphorus
191mg
200mg
1%
Vitamin E
0.22mg
1%
Protein per 100 calories
6.5g
2.5g
N/A
Calories per 10 g protein
154kcal
405kcal
N/A
Weight per 100 calories
30g
22g
N/A
Unsaturated / Saturated Fat ratio
1.5
1.8
N/A
Net carbs
2.4g
4.67g
N/A
Sugar
0.96g
N/A
Vitamin B5
1.201mg
1.2mg
0%
Trans fat
0.586g
N/A
Tryptophan
0.114mg
0.161mg
0%
Threonine
0.521mg
0.507mg
0%
Isoleucine
0.675mg
0.606mg
0%
Leucine
0.929mg
1.029mg
0%
Lysine
1.107mg
0.863mg
0%
Methionine
0.301mg
0.27mg
0%
Phenylalanine
0.481mg
0.567mg
0%
Valine
0.668mg
0.719mg
0%
Histidine
0.359mg
0.303mg
0%
Omega-3 - ALA
0.126g
N/A
Omega-6 - Eicosadienoic acid
0.084g
N/A
Omega-6 - Linoleic acid
2.104g
N/A
Macronutrient Comparison
Macronutrient breakdown side-by-side comparison
3
22%
26%
2%
45%
5%
Protein:
21.85 g
Fats:
25.9 g
Carbs:
2.4 g
Water:
45.19 g
Other:
4.66 g
2
11%
44%
5%
37%
3%
Protein:
11.4 g
Fats:
43.84 g
Carbs:
4.67 g
Water:
37.04 g
Other:
3.05 g
Contains
more
Protein Protein
+91.7%
Contains
more
Water Water
+22%
Contains
more
Other Other
+52.8%
Contains
more
Fats Fats
+69.3%
Contains
more
Carbs Carbs
+94.6%
Fat Type Comparison
Fat type breakdown side-by-side comparison
2
41%
48%
11%
Saturated fat:
Sat. Fat
9.316 g
Monounsaturated fat:
Mono. Fat
11.127 g
Polyunsaturated fat:
Poly. Fat
2.529 g
1
35%
63%
2%
Saturated fat:
Sat. Fat
14.45 g
Monounsaturated fat:
Mono. Fat
25.61 g
Polyunsaturated fat:
Poly. Fat
0.84 g
Contains
less
Sat. Fat Saturated fat
-35.5%
Contains
more
Poly. Fat Polyunsaturated fat
+201.1%
Contains
more
Mono. Fat Monounsaturated fat
+130.2%