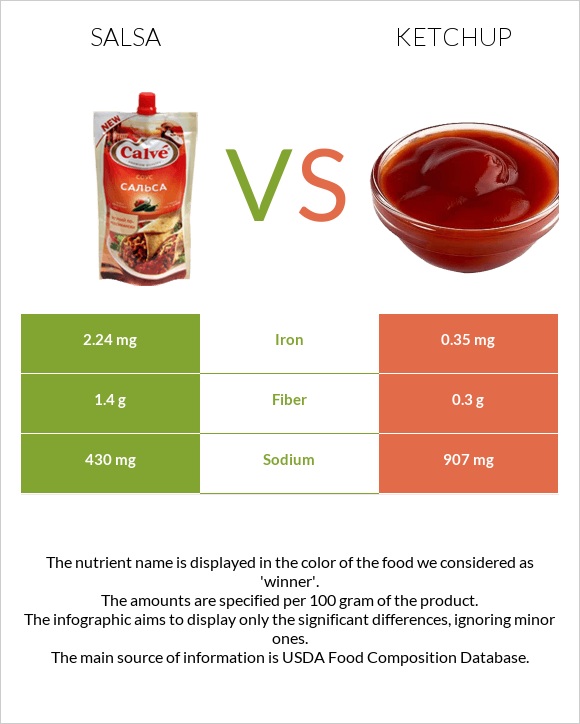
Summary of differences between salsa and ketchup Salsa has more iron; however, ketchup is higher in vitamin B2. Salsa covers your daily need for iron, 24% more than ketchup. Salsa has 5 times more fiber than ketchup. While salsa has 1.4g of fiber, ketchup has only 0.3g. Salsa has less sodium. These are the specific foods used in this comparison USDA Commodity, salsa and Catsup .
Infographic
Mineral Comparison
Mineral comparison score is based on the number of minerals by which one or the other food is richer. The "coverage" charts below show how much of the daily needs can be covered by 300 grams of the food.
5
100 g
300 g
Magnesium
Magnesium
Calcium
Calcium
Potassium
Potassium
Iron
Iron
Copper
Copper
Zinc
Zinc
Phosphorus
Phosphorus
Sodium
Sodium
Manganese
Manganese
Selenium
Selenium
11%
3.6%
24%
84%
32%
4.6%
13%
56%
0%
2.2%
3
100 g
300 g
1 packet - 9g 1 tbsp - 17g 1 cup - 240g
Magnesium
Magnesium
Calcium
Calcium
Potassium
Potassium
Iron
Iron
Copper
Copper
Zinc
Zinc
Phosphorus
Phosphorus
Sodium
Sodium
Manganese
Manganese
Selenium
Selenium
9.3%
4.5%
25%
13%
28%
4.6%
11%
118%
11%
3.8%
Vitamin Comparison
Vitamin comparison score is based on the number of vitamins by which one or the other food is richer. The "coverage" charts below show how much of the daily needs can be covered by 300 grams of the food.
2
100 g
300 g
Vitamin C
Vit. C
Vitamin D
Vit. D
Vitamin A
Vit. A
Vitamin E
Vit. E
Vitamin B1
Vit. B1
Vitamin B2
Vit. B2
Vitamin B3
Vit. B3
Vitamin B5
Vit. B5
Vitamin B6
Vit. B6
Vitamin B12
Vit. B12
Vitamin K
Vit. K
Folate
Folate
13%
0%
9.3%
0%
13%
6.9%
20%
0%
34%
0%
0%
14%
5
100 g
300 g
1 packet - 9g 1 tbsp - 17g 1 cup - 240g
Vitamin C
Vit. C
Vitamin D
Vit. D
Vitamin A
Vit. A
Vitamin E
Vit. E
Vitamin B1
Vit. B1
Vitamin B2
Vit. B2
Vitamin B3
Vit. B3
Vitamin B5
Vit. B5
Vitamin B6
Vit. B6
Vitamin B12
Vit. B12
Vitamin K
Vit. K
Folate
Folate
14%
0%
8.7%
29%
2.8%
38%
27%
2.8%
36%
0%
7.5%
6.8%
All nutrients comparison - raw data values
Nutrient
DV% diff.
Iron
2.24mg
0.35mg
24%
Sodium
430mg
907mg
21%
Fructose
8.72g
11%
Vitamin E
1.46mg
10%
Vitamin B2
0.03mg
0.166mg
10%
Carbs
7g
27.4g
7%
Fiber
1.4g
0.3g
4%
Manganese
0.084mg
4%
Calories
36kcal
101kcal
3%
Vitamin B1
0.05mg
0.011mg
3%
Vitamin K
3µg
3%
Folate
19µg
9µg
3%
Vitamin B3
1.08mg
1.434mg
2%
Choline
12.5mg
2%
Protein
1.5g
1.04g
1%
Magnesium
16mg
13mg
1%
Copper
0.096mg
0.085mg
1%
Phosphorus
30mg
26mg
1%
Selenium
0.4µg
0.7µg
1%
Vitamin B5
0.047mg
1%
Vitamin B6
0.149mg
0.158mg
1%
Protein per 100 calories
4.2g
1g
N/A
Calories per 10 g protein
240kcal
971kcal
N/A
Weight per 100 calories
278g
99g
N/A
Fats
0.2g
0.1g
0%
Vitamin C
4mg
4.1mg
0%
Net carbs
5.6g
27.1g
N/A
Calcium
12mg
15mg
0%
Potassium
270mg
281mg
0%
Sugar
21.27g
N/A
Zinc
0.17mg
0.17mg
0%
Vitamin A
28µg
26µg
0%
Saturated fat
0.029g
0.014g
0%
Monounsaturated fat
0.016g
0.015g
0%
Polyunsaturated fat
0.107g
0.041g
0%
Tryptophan
0.005mg
0%
Threonine
0.019mg
0%
Isoleucine
0.014mg
0%
Leucine
0.021mg
0%
Lysine
0.023mg
0%
Methionine
0.005mg
0%
Phenylalanine
0.021mg
0%
Valine
0.014mg
0%
Histidine
0.013mg
0%
Macronutrient Comparison
Macronutrient breakdown side-by-side comparison
3
7%
90%
Protein:
1.5 g
Fats:
0.2 g
Carbs:
7 g
Water:
89.7 g
Other:
1.6 g
2
27%
69%
3%
Protein:
1.04 g
Fats:
0.1 g
Carbs:
27.4 g
Water:
68.51 g
Other:
2.95 g
Contains
more
Protein Protein
+44.2%
Contains
more
Fats Fats
+100%
Contains
more
Water Water
+30.9%
Contains
more
Carbs Carbs
+291.4%
Contains
more
Other Other
+84.4%
Fat Type Comparison
Fat type breakdown side-by-side comparison
2
19%
11%
70%
Saturated fat:
Sat. Fat
0.029 g
Monounsaturated fat:
Mono. Fat
0.016 g
Polyunsaturated fat:
Poly. Fat
0.107 g
1
20%
21%
59%
Saturated fat:
Sat. Fat
0.014 g
Monounsaturated fat:
Mono. Fat
0.015 g
Polyunsaturated fat:
Poly. Fat
0.041 g
Contains
more
Poly. Fat Polyunsaturated fat
+161%
Contains
less
Sat. Fat Saturated fat
-51.7%
~equal in
Monounsaturated fat
~0.015g