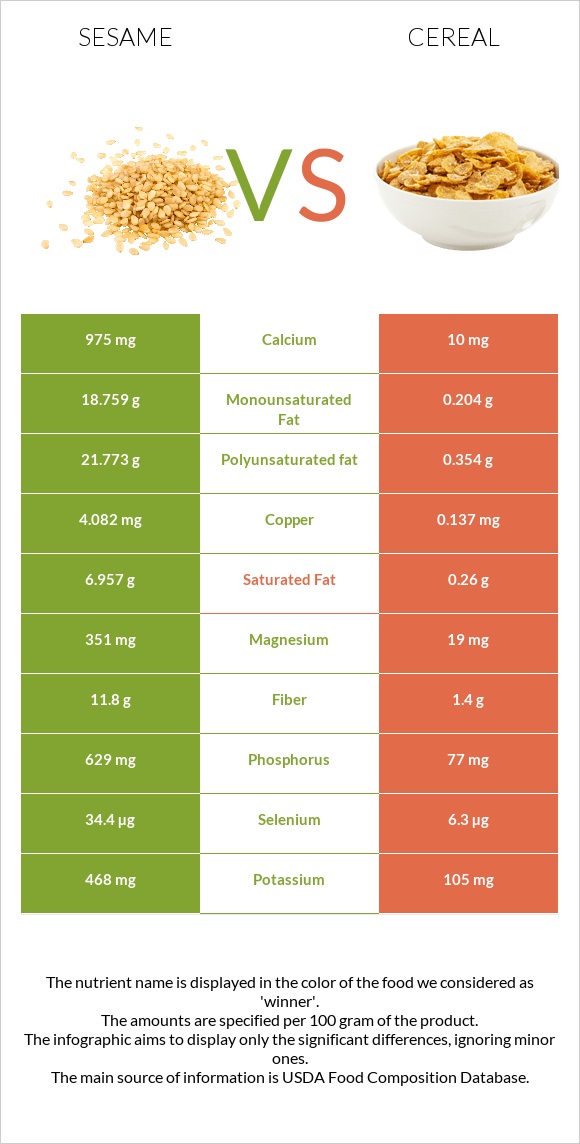
Differences between sesame and cereal Sesame has more copper, calcium, magnesium, phosphorus, and manganese, while cereal has more vitamin B1, vitamin B6, vitamin B2, iron, and vitamin B3. Cereal's daily need coverage for vitamin B1 is 458% higher. Cereal contains 98 times less calcium than sesame. Sesame contains 975mg of calcium, while cereal contains 10mg. The food types used in this comparison are Seeds, sesame seeds, whole, dried and Cereals ready-to-eat, USDA Commodity Corn and Rice (includes all commodity brands) .
Infographic
Mineral Comparison
Mineral comparison score is based on the number of minerals by which one or the other food is richer. The "coverage" charts below show how much of the daily needs can be covered by 300 grams of the food.
8
100 g
300 g
1 tbsp - 9g 1 cup - 144g
Magnesium
Magnesium
Calcium
Calcium
Potassium
Potassium
Iron
Iron
Copper
Copper
Zinc
Zinc
Phosphorus
Phosphorus
Sodium
Sodium
Manganese
Manganese
Selenium
Selenium
251%
293%
41%
546%
1361%
211%
270%
1.4%
321%
188%
1
100 g
300 g
1 cup - 29g 1 serving (NLEA serving = 1 cup) - 29g
Magnesium
Magnesium
Calcium
Calcium
Potassium
Potassium
Iron
Iron
Copper
Copper
Zinc
Zinc
Phosphorus
Phosphorus
Sodium
Sodium
Manganese
Manganese
Selenium
Selenium
14%
3%
9.3%
1277%
46%
207%
33%
104%
103%
34%
Vitamin Comparison
Vitamin comparison score is based on the number of vitamins by which one or the other food is richer. The "coverage" charts below show how much of the daily needs can be covered by 300 grams of the food.
2
100 g
300 g
1 tbsp - 9g 1 cup - 144g
Vitamin C
Vit. C
Vitamin D
Vit. D
Vitamin A
Vit. A
Vitamin E
Vit. E
Vitamin B1
Vit. B1
Vitamin B2
Vit. B2
Vitamin B3
Vit. B3
Vitamin B5
Vit. B5
Vitamin B6
Vit. B6
Vitamin B12
Vit. B12
Vitamin K
Vit. K
Folate
Folate
0%
0%
0%
5%
198%
57%
85%
3%
182%
0%
0%
73%
7
100 g
300 g
1 cup - 29g 1 serving (NLEA serving = 1 cup) - 29g
Vitamin C
Vit. C
Vitamin D
Vit. D
Vitamin A
Vit. A
Vitamin E
Vit. E
Vitamin B1
Vit. B1
Vitamin B2
Vit. B2
Vitamin B3
Vit. B3
Vitamin B5
Vit. B5
Vitamin B6
Vit. B6
Vitamin B12
Vit. B12
Vitamin K
Vit. K
Folate
Folate
128%
0%
271%
1.6%
1572%
893%
555%
14%
1381%
0%
0%
0%
All nutrients comparison - raw data values
Nutrient
DV% diff.
Vitamin B1
0.791mg
6.288mg
458%
Copper
4.082mg
0.137mg
438%
Vitamin B6
0.79mg
5.986mg
400%
Vitamin B2
0.247mg
3.87mg
279%
Iron
14.55mg
34.06mg
244%
Vitamin B3
4.515mg
29.62mg
157%
Polyunsaturated fat
21.773g
0.354g
143%
Calcium
975mg
10mg
97%
Vitamin A
0µg
814µg
90%
Magnesium
351mg
19mg
79%
Phosphorus
629mg
77mg
79%
Fats
49.67g
1.08g
75%
Manganese
2.46mg
0.79mg
73%
Selenium
34.4µg
6.3µg
51%
Monounsaturated fat
18.759g
0.204g
46%
Vitamin C
0mg
38.5mg
43%
Fiber
11.8g
1.4g
42%
Sodium
11mg
795mg
34%
Saturated fat
6.957g
0.26g
30%
Folate
97µg
24%
Protein
17.73g
6.06g
23%
Carbs
23.45g
86.85g
21%
Potassium
468mg
105mg
11%
Calories
573kcal
378kcal
10%
Choline
25.6mg
5%
Vitamin B5
0.05mg
0.226mg
4%
Zinc
7.75mg
7.6mg
1%
Vitamin E
0.25mg
0.08mg
1%
Protein per 100 calories
3.1g
1.6g
N/A
Calories per 10 g protein
323kcal
624kcal
N/A
Weight per 100 calories
17g
26g
N/A
Unsaturated / Saturated Fat ratio
5.8
2.1
N/A
Net carbs
11.65g
85.45g
N/A
Sugar
0.3g
10.35g
N/A
Tryptophan
0.388mg
0.066mg
0%
Threonine
0.736mg
0.241mg
0%
Isoleucine
0.763mg
0.26mg
0%
Leucine
1.358mg
0.767mg
0%
Lysine
0.569mg
0.113mg
0%
Methionine
0.586mg
0.13mg
0%
Phenylalanine
0.94mg
0.365mg
0%
Valine
0.99mg
0.344mg
0%
Histidine
0.522mg
0.162mg
0%
Fructose
0.26g
0%
Macronutrient Comparison
Macronutrient breakdown side-by-side comparison
4
18%
50%
23%
5%
4%
Protein:
17.73 g
Fats:
49.67 g
Carbs:
23.45 g
Water:
4.69 g
Other:
4.46 g
1
6%
87%
4%
2%
Protein:
6.06 g
Fats:
1.08 g
Carbs:
86.85 g
Water:
3.78 g
Other:
2.23 g
Contains
more
Protein Protein
+192.6%
Contains
more
Fats Fats
+4499.1%
Contains
more
Water Water
+24.1%
Contains
more
Other Other
+100%
Contains
more
Carbs Carbs
+270.4%
Fat Type Comparison
Fat type breakdown side-by-side comparison
2
15%
40%
46%
Saturated fat:
Sat. Fat
6.957 g
Monounsaturated fat:
Mono. Fat
18.759 g
Polyunsaturated fat:
Poly. Fat
21.773 g
1
32%
25%
43%
Saturated fat:
Sat. Fat
0.26 g
Monounsaturated fat:
Mono. Fat
0.204 g
Polyunsaturated fat:
Poly. Fat
0.354 g
Contains
more
Mono. Fat Monounsaturated fat
+9095.6%
Contains
more
Poly. Fat Polyunsaturated fat
+6050.6%
Contains
less
Sat. Fat Saturated fat
-96.3%