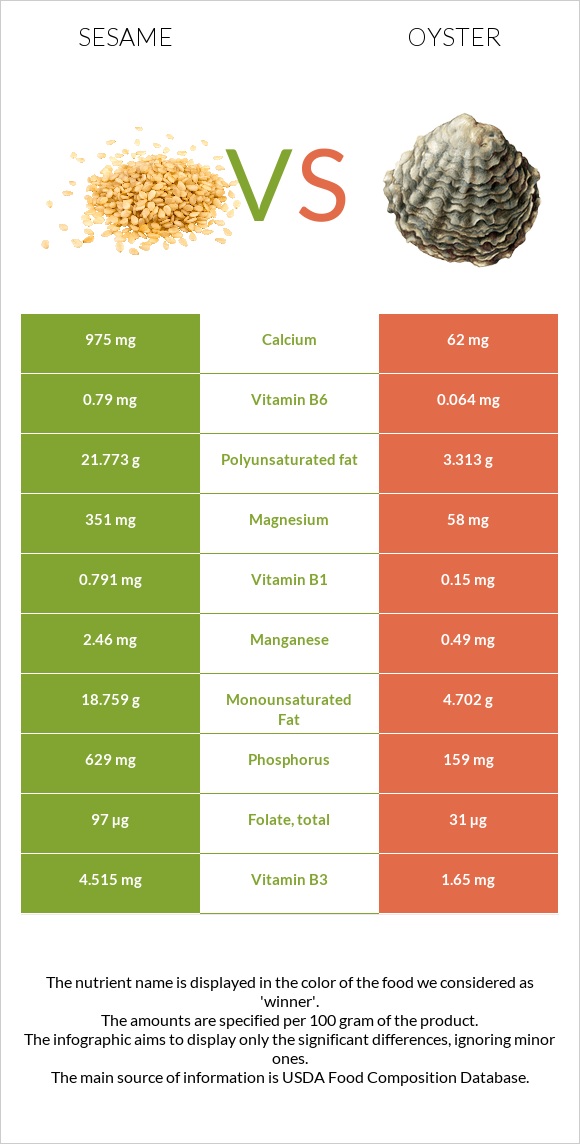
Important differences between sesame and oysters Sesame has more calcium, manganese, magnesium, iron, vitamin B1, phosphorus, and vitamin B6; however, oysters has more vitamin B12, zinc, and copper. Oysters's daily need coverage for vitamin B12 is 729% more. Sesame has 22 times more vitamin B1 than oysters. Sesame has 0.791mg of vitamin B1, while oysters has 0.036mg. The food varieties used in the comparison are Seeds, sesame seeds, whole, dried and Mollusks, oyster, eastern, wild, cooked, moist heat .
Infographic
Mineral Comparison
Mineral comparison score is based on the number of minerals by which one or the other food is richer. The "coverage" charts below show how much of the daily needs can be covered by 300 grams of the food.
7
100 g
300 g
1 tbsp - 9g 1 cup - 144g
Magnesium
Magnesium
Calcium
Calcium
Potassium
Potassium
Iron
Iron
Copper
Copper
Zinc
Zinc
Phosphorus
Phosphorus
Sodium
Sodium
Manganese
Manganese
Selenium
Selenium
251%
293%
41%
546%
1361%
211%
270%
1.4%
321%
188%
3
100 g
300 g
6 medium - 42g 3 oz - 85g
Magnesium
Magnesium
Calcium
Calcium
Potassium
Potassium
Iron
Iron
Copper
Copper
Zinc
Zinc
Phosphorus
Phosphorus
Sodium
Sodium
Manganese
Manganese
Selenium
Selenium
25%
35%
12%
345%
1902%
2144%
83%
22%
77%
215%
Vitamin Comparison
Vitamin comparison score is based on the number of vitamins by which one or the other food is richer. The "coverage" charts below show how much of the daily needs can be covered by 300 grams of the food.
5
100 g
300 g
1 tbsp - 9g 1 cup - 144g
Vitamin C
Vit. C
Vitamin D
Vit. D
Vitamin A
Vit. A
Vitamin E
Vit. E
Vitamin B1
Vit. B1
Vitamin B2
Vit. B2
Vitamin B3
Vit. B3
Vitamin B5
Vit. B5
Vitamin B6
Vit. B6
Vitamin B12
Vit. B12
Vitamin K
Vit. K
Folate
Folate
0%
0%
0%
5%
198%
57%
85%
3%
182%
0%
0%
73%
5
100 g
300 g
6 medium - 42g 3 oz - 85g
Vitamin C
Vit. C
Vitamin D
Vit. D
Vitamin A
Vit. A
Vitamin E
Vit. E
Vitamin B1
Vit. B1
Vitamin B2
Vit. B2
Vitamin B3
Vit. B3
Vitamin B5
Vit. B5
Vitamin B6
Vit. B6
Vitamin B12
Vit. B12
Vitamin K
Vit. K
Folate
Folate
0%
0%
8.7%
34%
9%
42%
35%
27%
14%
2188%
5%
11%
All nutrients comparison - raw data values
Nutrient
DV% diff.
Vitamin B12
0µg
17.5µg
729%
Zinc
7.75mg
78.6mg
644%
Copper
4.082mg
5.707mg
181%
Polyunsaturated fat
21.773g
1.056g
138%
Calcium
975mg
116mg
86%
Manganese
2.46mg
0.591mg
81%
Magnesium
351mg
35mg
75%
Fats
49.67g
3.42g
71%
Iron
14.55mg
9.21mg
67%
Vitamin B1
0.791mg
0.036mg
63%
Phosphorus
629mg
194mg
62%
Vitamin B6
0.79mg
0.061mg
56%
Fiber
11.8g
0g
47%
Monounsaturated fat
18.759g
0.506g
46%
Saturated fat
6.957g
0.948g
27%
Cholesterol
0mg
79mg
26%
Calories
573kcal
102kcal
24%
Folate
97µg
14µg
21%
Choline
25.6mg
130mg
19%
Vitamin B3
4.515mg
1.85mg
17%
Protein
17.73g
11.42g
13%
Potassium
468mg
139mg
10%
Vitamin E
0.25mg
1.7mg
10%
Selenium
34.4µg
39.5µg
9%
Vitamin B5
0.05mg
0.447mg
8%
Sodium
11mg
166mg
7%
Carbs
23.45g
5.45g
6%
Vitamin B2
0.247mg
0.18mg
5%
Vitamin A
0µg
26µg
3%
Vitamin K
0µg
2µg
2%
Protein per 100 calories
3.1g
11g
N/A
Calories per 10 g protein
323kcal
89kcal
N/A
Weight per 100 calories
17g
98g
N/A
Unsaturated / Saturated Fat ratio
5.8
1.6
N/A
Net carbs
11.65g
5.45g
N/A
Vitamin D*
0 IU
2 IU
0%
Sugar
0.3g
1.23g
N/A
Starch
0.9g
0%
Trans fat
0.068g
N/A
Tryptophan
0.388mg
0.138mg
0%
Threonine
0.736mg
0.046mg
0%
Isoleucine
0.763mg
0.459mg
0%
Leucine
1.358mg
0.716mg
0%
Lysine
0.569mg
0.762mg
0%
Methionine
0.586mg
0.257mg
0%
Phenylalanine
0.94mg
0.413mg
0%
Valine
0.99mg
0.523mg
0%
Histidine
0.522mg
0.22mg
0%
Omega-3 - EPA
0g
0.353g
N/A
Omega-3 - DHA
0g
0.271g
N/A
Omega-3 - ALA
0.163g
N/A
Omega-3 - DPA
0g
0.02g
N/A
Omega-3 - Eicosatrienoic acid
0.004g
N/A
Omega-6 - Gamma-linoleic acid
0.004g
N/A
Omega-6 - Dihomo-gamma-linoleic acid
0.007g
N/A
Omega-6 - Eicosadienoic acid
0.007g
N/A
Omega-6 - Linoleic acid
0.061g
N/A
Macronutrient Comparison
Macronutrient breakdown side-by-side comparison
4
18%
50%
23%
5%
4%
Protein:
17.73 g
Fats:
49.67 g
Carbs:
23.45 g
Water:
4.69 g
Other:
4.46 g
1
11%
3%
5%
78%
Protein:
11.42 g
Fats:
3.42 g
Carbs:
5.45 g
Water:
78.19 g
Other:
1.52 g
Contains
more
Protein Protein
+55.3%
Contains
more
Fats Fats
+1352.3%
Contains
more
Carbs Carbs
+330.3%
Contains
more
Other Other
+193.4%
Contains
more
Water Water
+1567.2%
Fat Type Comparison
Fat type breakdown side-by-side comparison
2
15%
40%
46%
Saturated fat:
Sat. Fat
6.957 g
Monounsaturated fat:
Mono. Fat
18.759 g
Polyunsaturated fat:
Poly. Fat
21.773 g
1
38%
20%
42%
Saturated fat:
Sat. Fat
0.948 g
Monounsaturated fat:
Mono. Fat
0.506 g
Polyunsaturated fat:
Poly. Fat
1.056 g
Contains
more
Mono. Fat Monounsaturated fat
+3607.3%
Contains
more
Poly. Fat Polyunsaturated fat
+1961.8%
Contains
less
Sat. Fat Saturated fat
-86.4%