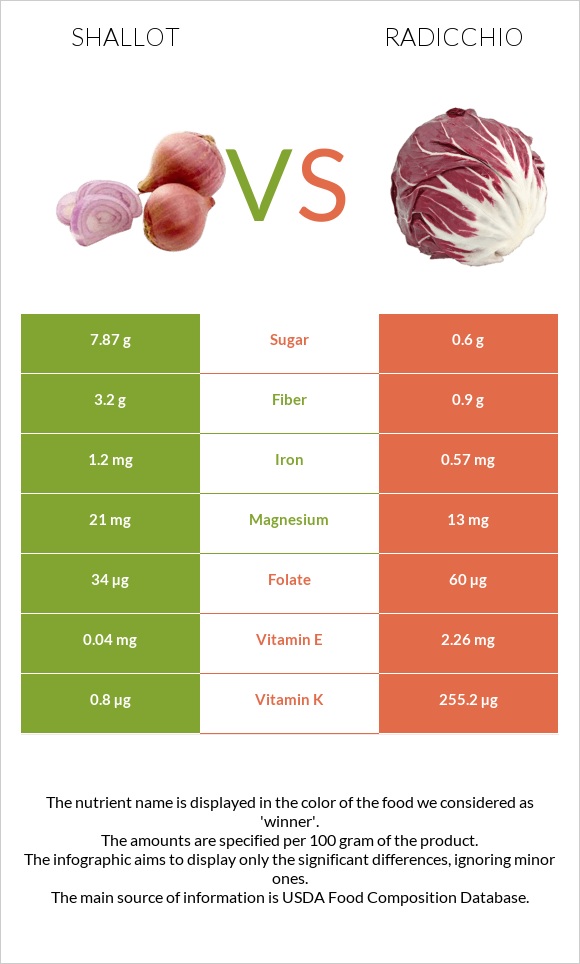
How are shallots and radicchio different? Shallots are higher in vitamin B6, fiber, iron, and manganese; however, radicchio is richer in vitamin K, copper, vitamin E, and folate. Daily need coverage for vitamin K for radicchio is 212% higher. Shallots contain 13 times more sugar than radicchio. While shallots contain 7.87g of sugar, radicchio contains only 0.6g. Shallots, raw and Radicchio, raw are the varieties used in this article.
Infographic
Mineral Comparison
Mineral comparison score is based on the number of minerals by which one or the other food is richer. The "coverage" charts below show how much of the daily needs can be covered by 300 grams of the food.
7
100 g
300 g
1 tbsp chopped - 10g
Magnesium
Magnesium
Calcium
Calcium
Potassium
Potassium
Iron
Iron
Copper
Copper
Zinc
Zinc
Phosphorus
Phosphorus
Sodium
Sodium
Manganese
Manganese
Selenium
Selenium
15%
11%
29%
45%
29%
11%
26%
1.6%
38%
6.5%
2
100 g
300 g
1 leaf - 8g 1 cup, shredded - 40g
Magnesium
Magnesium
Calcium
Calcium
Potassium
Potassium
Iron
Iron
Copper
Copper
Zinc
Zinc
Phosphorus
Phosphorus
Sodium
Sodium
Manganese
Manganese
Selenium
Selenium
9.3%
5.7%
27%
21%
114%
17%
17%
2.9%
18%
4.9%
Vitamin Comparison
Vitamin comparison score is based on the number of vitamins by which one or the other food is richer. The "coverage" charts below show how much of the daily needs can be covered by 300 grams of the food.
2
100 g
300 g
1 tbsp chopped - 10g
Vitamin C
Vit. C
Vitamin D
Vit. D
Vitamin A
Vit. A
Vitamin E
Vit. E
Vitamin B1
Vit. B1
Vitamin B2
Vit. B2
Vitamin B3
Vit. B3
Vitamin B5
Vit. B5
Vitamin B6
Vit. B6
Vitamin B12
Vit. B12
Vitamin K
Vit. K
Folate
Folate
27%
0%
0%
0.8%
15%
4.6%
3.8%
17%
80%
0%
2%
26%
6
100 g
300 g
1 leaf - 8g 1 cup, shredded - 40g
Vitamin C
Vit. C
Vitamin D
Vit. D
Vitamin A
Vit. A
Vitamin E
Vit. E
Vitamin B1
Vit. B1
Vitamin B2
Vit. B2
Vitamin B3
Vit. B3
Vitamin B5
Vit. B5
Vitamin B6
Vit. B6
Vitamin B12
Vit. B12
Vitamin K
Vit. K
Folate
Folate
27%
0%
0.33%
45%
4%
6.5%
4.8%
16%
13%
0%
638%
45%
All nutrients comparison - raw data values
Nutrient
DV% diff.
Vitamin K
0.8µg
255.2µg
212%
Copper
0.088mg
0.341mg
28%
Vitamin B6
0.345mg
0.057mg
22%
Vitamin E
0.04mg
2.26mg
15%
Fiber
3.2g
0.9g
9%
Iron
1.2mg
0.57mg
8%
Manganese
0.292mg
0.138mg
7%
Folate
34µg
60µg
7%
Carbs
16.8g
4.48g
4%
Vitamin B1
0.06mg
0.016mg
4%
Phosphorus
60mg
40mg
3%
Calories
72kcal
23kcal
2%
Protein
2.5g
1.43g
2%
Magnesium
21mg
13mg
2%
Calcium
37mg
19mg
2%
Zinc
0.4mg
0.62mg
2%
Potassium
334mg
302mg
1%
Selenium
1.2µg
0.9µg
1%
Vitamin B2
0.02mg
0.028mg
1%
Protein per 100 calories
3.5g
6.2g
N/A
Calories per 10 g protein
288kcal
161kcal
N/A
Weight per 100 calories
139g
435g
N/A
Fats
0.1g
0.25g
0%
Vitamin C
8mg
8mg
0%
Net carbs
13.6g
3.58g
N/A
Sugar
7.87g
0.6g
N/A
Sodium
12mg
22mg
0%
Vitamin A
0µg
1µg
0%
Vitamin B3
0.2mg
0.255mg
0%
Vitamin B5
0.29mg
0.269mg
0%
Choline
11.3mg
10.9mg
0%
Saturated fat
0.017g
0.06g
0%
Monounsaturated fat
0.014g
0.01g
0%
Polyunsaturated fat
0.039g
0.11g
0%
Tryptophan
0.028mg
0.026mg
0%
Threonine
0.098mg
0.04mg
0%
Isoleucine
0.106mg
0.085mg
0%
Leucine
0.149mg
0.062mg
0%
Lysine
0.125mg
0.056mg
0%
Methionine
0.027mg
0.008mg
0%
Phenylalanine
0.081mg
0.034mg
0%
Valine
0.11mg
0.065mg
0%
Histidine
0.043mg
0.024mg
0%
Macronutrient Comparison
Macronutrient breakdown side-by-side comparison
3
3%
17%
80%
Protein:
2.5 g
Fats:
0.1 g
Carbs:
16.8 g
Water:
79.8 g
Other:
0.8 g
2
4%
93%
Protein:
1.43 g
Fats:
0.25 g
Carbs:
4.48 g
Water:
93.14 g
Other:
0.7 g
Contains
more
Protein Protein
+74.8%
Contains
more
Carbs Carbs
+275%
Contains
more
Other Other
+14.3%
Contains
more
Fats Fats
+150%
Contains
more
Water Water
+16.7%
Fat Type Comparison
Fat type breakdown side-by-side comparison
2
24%
20%
56%
Saturated fat:
Sat. Fat
0.017 g
Monounsaturated fat:
Mono. Fat
0.014 g
Polyunsaturated fat:
Poly. Fat
0.039 g
1
33%
6%
61%
Saturated fat:
Sat. Fat
0.06 g
Monounsaturated fat:
Mono. Fat
0.01 g
Polyunsaturated fat:
Poly. Fat
0.11 g
Contains
less
Sat. Fat Saturated fat
-71.7%
Contains
more
Mono. Fat Monounsaturated fat
+40%
Contains
more
Poly. Fat Polyunsaturated fat
+182.1%