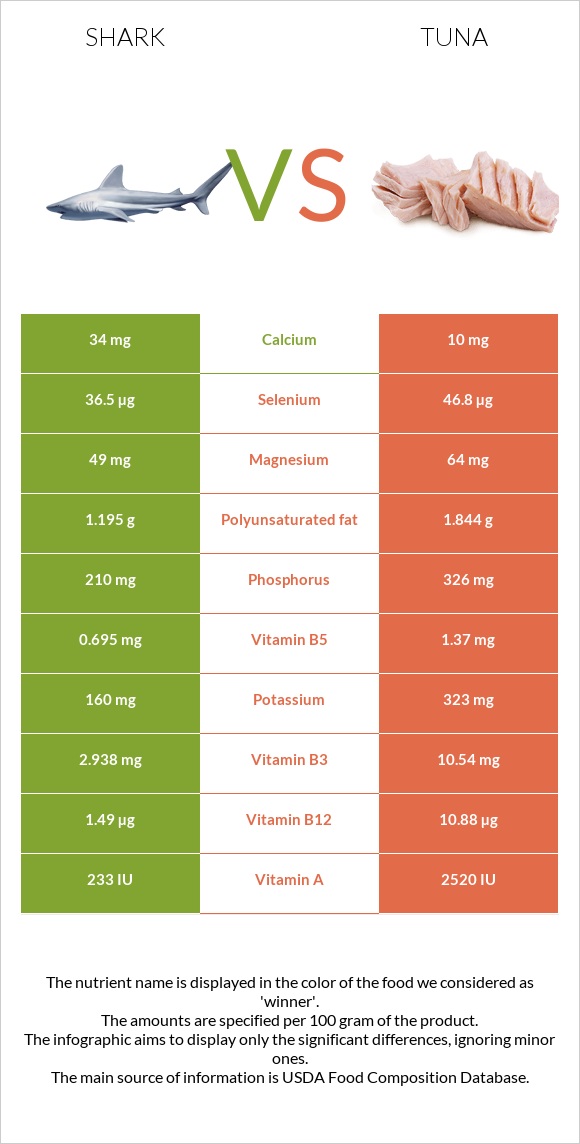
What are the differences between shark and tuna? Shark is higher in vitamin B5, yet tuna is higher in selenium, vitamin B3, vitamin B6, vitamin B12, phosphorus, potassium, and vitamin B1. Tuna's daily need coverage for selenium is 135% more. Shark has 16 times more saturated fat than tuna. While shark has 3.205g of saturated fat, tuna has only 0.205g. We used Fish, shark, mixed species, cooked, batter-dipped and fried and Fish, tuna, yellowfin, fresh, cooked, dry heat types in this article.
Infographic
Mineral Comparison
Mineral comparison score is based on the number of minerals by which one or the other food is richer. The "coverage" charts below show how much of the daily needs can be covered by 300 grams of the food.
3
100 g
300 g
3 oz - 85g
Magnesium
Magnesium
Calcium
Calcium
Potassium
Potassium
Iron
Iron
Copper
Copper
Zinc
Zinc
Phosphorus
Phosphorus
Sodium
Sodium
Manganese
Manganese
Selenium
Selenium
31%
15%
14%
42%
14%
13%
83%
16%
6.5%
185%
4
100 g
300 g
3 oz - 85g
Magnesium
Magnesium
Calcium
Calcium
Potassium
Potassium
Iron
Iron
Copper
Copper
Zinc
Zinc
Phosphorus
Phosphorus
Sodium
Sodium
Manganese
Manganese
Selenium
Selenium
30%
1.2%
47%
35%
14%
12%
143%
7%
1.7%
590%
Vitamin Comparison
Vitamin comparison score is based on the number of vitamins by which one or the other food is richer. The "coverage" charts below show how much of the daily needs can be covered by 300 grams of the food.
3
100 g
300 g
3 oz - 85g
Vitamin C
Vit. C
Vitamin D
Vit. D
Vitamin A
Vit. A
Vitamin E
Vit. E
Vitamin B1
Vit. B1
Vitamin B2
Vit. B2
Vitamin B3
Vit. B3
Vitamin B5
Vit. B5
Vitamin B6
Vit. B6
Vitamin B12
Vit. B12
Vitamin K
Vit. K
Folate
Folate
0%
0%
18%
0%
18%
22%
52%
37%
69%
151%
0%
11%
8
100 g
300 g
3 oz - 85g
Vitamin C
Vit. C
Vitamin D
Vit. D
Vitamin A
Vit. A
Vitamin E
Vit. E
Vitamin B1
Vit. B1
Vitamin B2
Vit. B2
Vitamin B3
Vit. B3
Vitamin B5
Vit. B5
Vitamin B6
Vit. B6
Vitamin B12
Vit. B12
Vitamin K
Vit. K
Folate
Folate
0%
30%
7.3%
5.8%
34%
32%
414%
20%
240%
294%
0.25%
1.5%
All nutrients comparison - raw data values
Nutrient
DV% diff.
Selenium
34µg
108.2µg
135%
Vitamin B3
2.783mg
22.07mg
121%
Vitamin B6
0.3mg
1.038mg
57%
Vitamin B12
1.21µg
2.35µg
48%
Polyunsaturated fat
3.701g
0.175g
24%
Protein
18.62g
29.15g
21%
Fats
13.82g
0.59g
20%
Phosphorus
194mg
333mg
20%
Choline
77.6mg
14%
Saturated fat
3.205g
0.205g
14%
Monounsaturated fat
5.935g
0.138g
14%
Potassium
155mg
527mg
11%
Vitamin D*
82 IU
10%
Vitamin D
2µg
10%
Vitamin B5
0.62mg
0.334mg
6%
Calories
228kcal
130kcal
5%
Calcium
50mg
4mg
5%
Vitamin B1
0.072mg
0.134mg
5%
Cholesterol
59mg
47mg
4%
Vitamin A
54µg
22µg
4%
Sodium
122mg
54mg
3%
Vitamin B2
0.097mg
0.137mg
3%
Folate
15µg
2µg
3%
Carbs
6.39g
0g
2%
Iron
1.11mg
0.92mg
2%
Vitamin E
0.29mg
2%
Manganese
0.05mg
0.013mg
2%
Protein per 100 calories
8.2g
22g
N/A
Calories per 10 g protein
122kcal
45kcal
N/A
Weight per 100 calories
44g
77g
N/A
Unsaturated / Saturated Fat ratio
3
1.5
N/A
Net carbs
6.39g
0g
N/A
Magnesium
43mg
42mg
0%
Copper
0.042mg
0.043mg
0%
Zinc
0.48mg
0.45mg
0%
Vitamin K
0.1µg
0%
Trans fat
0.02g
N/A
Tryptophan
0.212mg
0.313mg
0%
Threonine
0.843mg
1.224mg
0%
Isoleucine
0.867mg
1.287mg
0%
Leucine
1.515mg
2.27mg
0%
Lysine
1.634mg
2.565mg
0%
Methionine
0.541mg
0.827mg
0%
Phenylalanine
0.75mg
1.091mg
0%
Valine
0.965mg
1.438mg
0%
Histidine
0.538mg
0.822mg
0%
Omega-3 - EPA
0.258g
0.015g
N/A
Omega-3 - DHA
0.431g
0.105g
N/A
Omega-3 - DPA
0.089g
0.005g
N/A
Omega-6 - Eicosadienoic acid
0.002g
N/A
Macronutrient Comparison
Macronutrient breakdown side-by-side comparison
2
19%
14%
6%
60%
Protein:
18.62 g
Fats:
13.82 g
Carbs:
6.39 g
Water:
60.09 g
Other:
1.08 g
3
29%
69%
Protein:
29.15 g
Fats:
0.59 g
Carbs:
0 g
Water:
68.98 g
Other:
1.28 g
Contains
more
Fats Fats
+2242.4%
Contains
more
Carbs Carbs
+∞%
Contains
more
Protein Protein
+56.6%
Contains
more
Water Water
+14.8%
Contains
more
Other Other
+18.5%
Fat Type Comparison
Fat type breakdown side-by-side comparison
2
25%
46%
29%
Saturated fat:
Sat. Fat
3.205 g
Monounsaturated fat:
Mono. Fat
5.935 g
Polyunsaturated fat:
Poly. Fat
3.701 g
1
40%
27%
34%
Saturated fat:
Sat. Fat
0.205 g
Monounsaturated fat:
Mono. Fat
0.138 g
Polyunsaturated fat:
Poly. Fat
0.175 g
Contains
more
Mono. Fat Monounsaturated fat
+4200.7%
Contains
more
Poly. Fat Polyunsaturated fat
+2014.9%
Contains
less
Sat. Fat Saturated fat
-93.6%