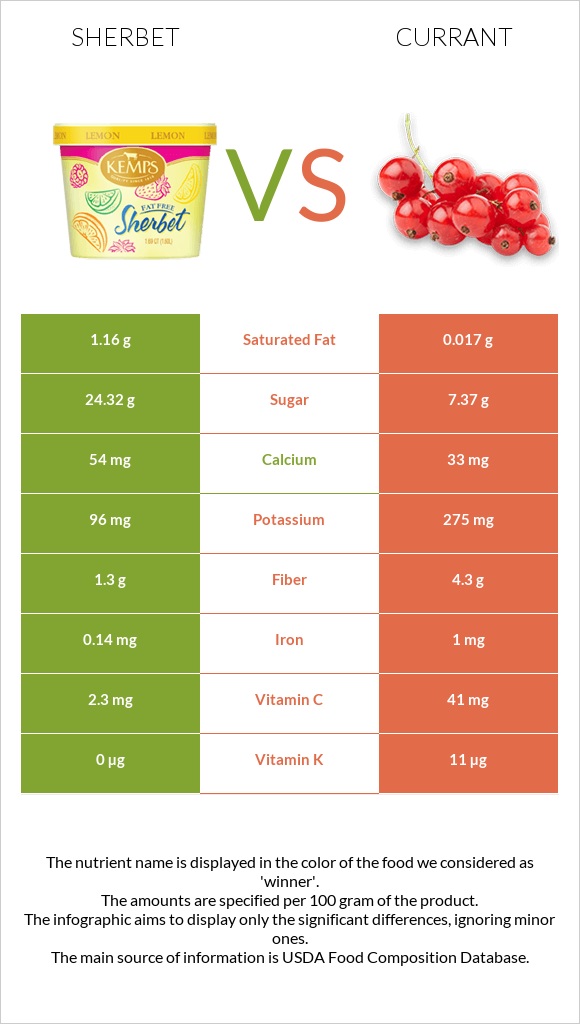
Differences between sherbet and currants Sherbet has more vitamin B12, while currants have more vitamin C, fiber, iron, vitamin K, copper, manganese, and potassium. Currants' daily need coverage for vitamin C is 43% higher. The amount of saturated fat in currants is lower. Currants have a lower glycemic index. The glycemic index of currants is 25, while the glycemic index of sherbet is 59. The food types used in this comparison are Sherbet, orange and Currants, red, and white, raw .
Infographic
Mineral Comparison
Mineral comparison score is based on the number of minerals by which one or the other food is richer. The "coverage" charts below show how much of the daily needs can be covered by 300 grams of the food.
3
100 g
300 g
1 bar (2.75 fl oz) - 66g 0.5 cup (4 fl oz) - 74g
Magnesium
Magnesium
Calcium
Calcium
Potassium
Potassium
Iron
Iron
Copper
Copper
Zinc
Zinc
Phosphorus
Phosphorus
Sodium
Sodium
Manganese
Manganese
Selenium
Selenium
5.7%
16%
8.5%
5.3%
9.3%
13%
17%
6%
1.4%
8.2%
6
100 g
300 g
1 cup - 112g
Magnesium
Magnesium
Calcium
Calcium
Potassium
Potassium
Iron
Iron
Copper
Copper
Zinc
Zinc
Phosphorus
Phosphorus
Sodium
Sodium
Manganese
Manganese
Selenium
Selenium
9.3%
9.9%
24%
38%
36%
6.3%
19%
0.13%
24%
3.3%
Vitamin Comparison
Vitamin comparison score is based on the number of vitamins by which one or the other food is richer. The "coverage" charts below show how much of the daily needs can be covered by 300 grams of the food.
4
100 g
300 g
1 bar (2.75 fl oz) - 66g 0.5 cup (4 fl oz) - 74g
Vitamin C
Vit. C
Vitamin D
Vit. D
Vitamin A
Vit. A
Vitamin E
Vit. E
Vitamin B1
Vit. B1
Vitamin B2
Vit. B2
Vitamin B3
Vit. B3
Vitamin B5
Vit. B5
Vitamin B6
Vit. B6
Vitamin B12
Vit. B12
Vitamin K
Vit. K
Folate
Folate
7.7%
0%
4%
0.2%
6.8%
22%
1.2%
13%
5.3%
16%
0%
3%
7
100 g
300 g
1 cup - 112g
Vitamin C
Vit. C
Vitamin D
Vit. D
Vitamin A
Vit. A
Vitamin E
Vit. E
Vitamin B1
Vit. B1
Vitamin B2
Vit. B2
Vitamin B3
Vit. B3
Vitamin B5
Vit. B5
Vitamin B6
Vit. B6
Vitamin B12
Vit. B12
Vitamin K
Vit. K
Folate
Folate
137%
0%
0.67%
2%
10%
12%
1.9%
3.8%
16%
0%
28%
6%
All nutrients comparison - raw data values
Nutrient
DV% diff.
Vitamin C
2.3mg
41mg
43%
Fiber
1.3g
4.3g
12%
Iron
0.14mg
1mg
11%
Copper
0.028mg
0.107mg
9%
Vitamin K
0µg
11µg
9%
Manganese
0.011mg
0.186mg
8%
Carbs
30.4g
13.8g
6%
Potassium
96mg
275mg
5%
Vitamin B12
0.13µg
0µg
5%
Saturated fat
1.16g
0.017g
5%
Calories
144kcal
56kcal
4%
Vitamin B2
0.097mg
0.05mg
4%
Vitamin B6
0.023mg
0.07mg
4%
Fructose
3.53g
4%
Fats
2g
0.2g
3%
Vitamin B5
0.224mg
0.064mg
3%
Calcium
54mg
33mg
2%
Zinc
0.48mg
0.23mg
2%
Sodium
46mg
1mg
2%
Selenium
1.5µg
0.6µg
2%
Protein
1.1g
1.4g
1%
Magnesium
8mg
13mg
1%
Phosphorus
40mg
44mg
1%
Vitamin A
12µg
2µg
1%
Vitamin E
0.01mg
0.1mg
1%
Vitamin B1
0.027mg
0.04mg
1%
Folate
4µg
8µg
1%
Monounsaturated fat
0.53g
0.028g
1%
Protein per 100 calories
0.76g
2.5g
N/A
Calories per 10 g protein
1309kcal
400kcal
N/A
Weight per 100 calories
69g
179g
N/A
Net carbs
29.1g
9.5g
N/A
Cholesterol
1mg
0mg
0%
Sugar
24.32g
7.37g
N/A
Vitamin B3
0.063mg
0.1mg
0%
Choline
7.7mg
7.6mg
0%
Polyunsaturated fat
0.08g
0.088g
0%
Macronutrient Comparison
Macronutrient breakdown side-by-side comparison
2
2%
30%
66%
Protein:
1.1 g
Fats:
2 g
Carbs:
30.4 g
Water:
66.1 g
Other:
0.4 g
3
14%
84%
Protein:
1.4 g
Fats:
0.2 g
Carbs:
13.8 g
Water:
83.95 g
Other:
0.65 g
Contains
more
Fats Fats
+900%
Contains
more
Carbs Carbs
+120.3%
Contains
more
Protein Protein
+27.3%
Contains
more
Water Water
+27%
Contains
more
Other Other
+62.5%
Fat Type Comparison
Fat type breakdown side-by-side comparison
1
66%
30%
5%
Saturated fat:
Sat. Fat
1.16 g
Monounsaturated fat:
Mono. Fat
0.53 g
Polyunsaturated fat:
Poly. Fat
0.08 g
2
13%
21%
66%
Saturated fat:
Sat. Fat
0.017 g
Monounsaturated fat:
Mono. Fat
0.028 g
Polyunsaturated fat:
Poly. Fat
0.088 g
Contains
more
Mono. Fat Monounsaturated fat
+1792.9%
Contains
less
Sat. Fat Saturated fat
-98.5%
~equal in
Polyunsaturated fat
~0.088g