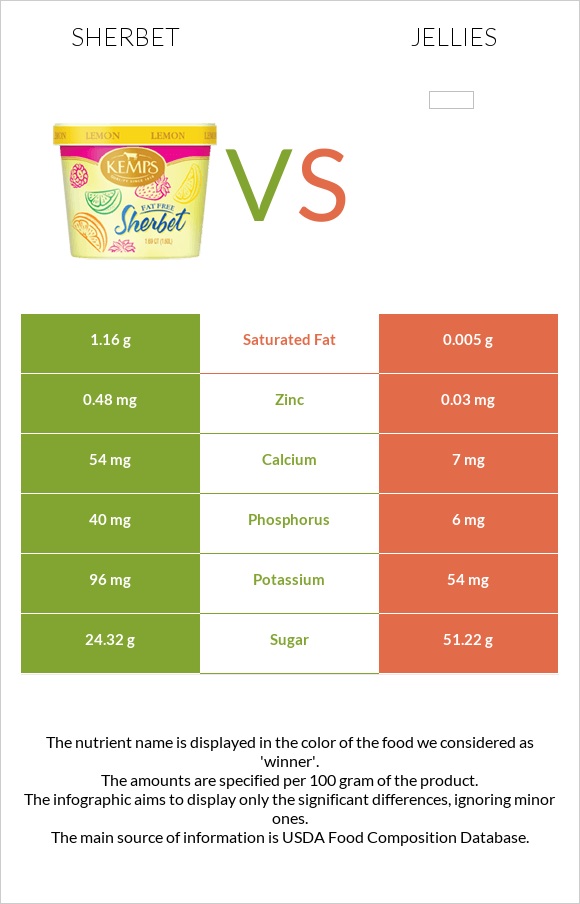
What are the differences between sherbet and jellies? Sherbet is higher in vitamin B2 and vitamin B12, yet jellies are higher in manganese. The amount of saturated fat in jellies is lower. We used Sherbet, orange and Jellies types in this article.
Infographic
Mineral Comparison
Mineral comparison score is based on the number of minerals by which one or the other food is richer. The "coverage" charts below show how much of the daily needs can be covered by 300 grams of the food.
7
100 g
300 g
1 bar (2.75 fl oz) - 66g 0.5 cup (4 fl oz) - 74g
Magnesium
Magnesium
Calcium
Calcium
Potassium
Potassium
Iron
Iron
Copper
Copper
Zinc
Zinc
Phosphorus
Phosphorus
Sodium
Sodium
Manganese
Manganese
Selenium
Selenium
5.7%
16%
8.5%
5.3%
9.3%
13%
17%
6%
1.4%
8.2%
3
100 g
300 g
1 packet (0.5 oz) - 14g 1 serving 1 tbsp - 21g
Magnesium
Magnesium
Calcium
Calcium
Potassium
Potassium
Iron
Iron
Copper
Copper
Zinc
Zinc
Phosphorus
Phosphorus
Sodium
Sodium
Manganese
Manganese
Selenium
Selenium
4.3%
2.1%
4.8%
7.1%
3.7%
0.82%
2.6%
3.9%
17%
2.2%
Vitamin Comparison
Vitamin comparison score is based on the number of vitamins by which one or the other food is richer. The "coverage" charts below show how much of the daily needs can be covered by 300 grams of the food.
10
100 g
300 g
1 bar (2.75 fl oz) - 66g 0.5 cup (4 fl oz) - 74g
Vitamin C
Vit. C
Vitamin D
Vit. D
Vitamin A
Vit. A
Vitamin E
Vit. E
Vitamin B1
Vit. B1
Vitamin B2
Vit. B2
Vitamin B3
Vit. B3
Vitamin B5
Vit. B5
Vitamin B6
Vit. B6
Vitamin B12
Vit. B12
Vitamin K
Vit. K
Folate
Folate
7.7%
0%
4%
0.2%
6.8%
22%
1.2%
13%
5.3%
16%
0%
3%
1
100 g
300 g
1 packet (0.5 oz) - 14g 1 serving 1 tbsp - 21g
Vitamin C
Vit. C
Vitamin D
Vit. D
Vitamin A
Vit. A
Vitamin E
Vit. E
Vitamin B1
Vit. B1
Vitamin B2
Vit. B2
Vitamin B3
Vit. B3
Vitamin B5
Vit. B5
Vitamin B6
Vit. B6
Vitamin B12
Vit. B12
Vitamin K
Vit. K
Folate
Folate
3%
0%
0%
0%
0.25%
6%
0.68%
12%
4.6%
0%
0.75%
1.5%
All nutrients comparison - raw data values
Macronutrient Comparison
Macronutrient breakdown side-by-side comparison
4
2%
30%
66%
Protein:
1.1 g
Fats:
2 g
Carbs:
30.4 g
Water:
66.1 g
Other:
0.4 g
1
70%
30%
Protein:
0.15 g
Fats:
0.02 g
Carbs:
69.95 g
Water:
29.77 g
Other:
0.11 g
Contains
more
Protein Protein
+633.3%
Contains
more
Fats Fats
+9900%
Contains
more
Water Water
+122%
Contains
more
Other Other
+263.6%
Contains
more
Carbs Carbs
+130.1%
Fat Type Comparison
Fat type breakdown side-by-side comparison
2
66%
30%
5%
Saturated fat:
Sat. Fat
1.16 g
Monounsaturated fat:
Mono. Fat
0.53 g
Polyunsaturated fat:
Poly. Fat
0.08 g
1
50%
10%
40%
Saturated fat:
Sat. Fat
0.005 g
Monounsaturated fat:
Mono. Fat
0.001 g
Polyunsaturated fat:
Poly. Fat
0.004 g
Contains
more
Mono. Fat Monounsaturated fat
+52900%
Contains
more
Poly. Fat Polyunsaturated fat
+1900%
Contains
less
Sat. Fat Saturated fat
-99.6%