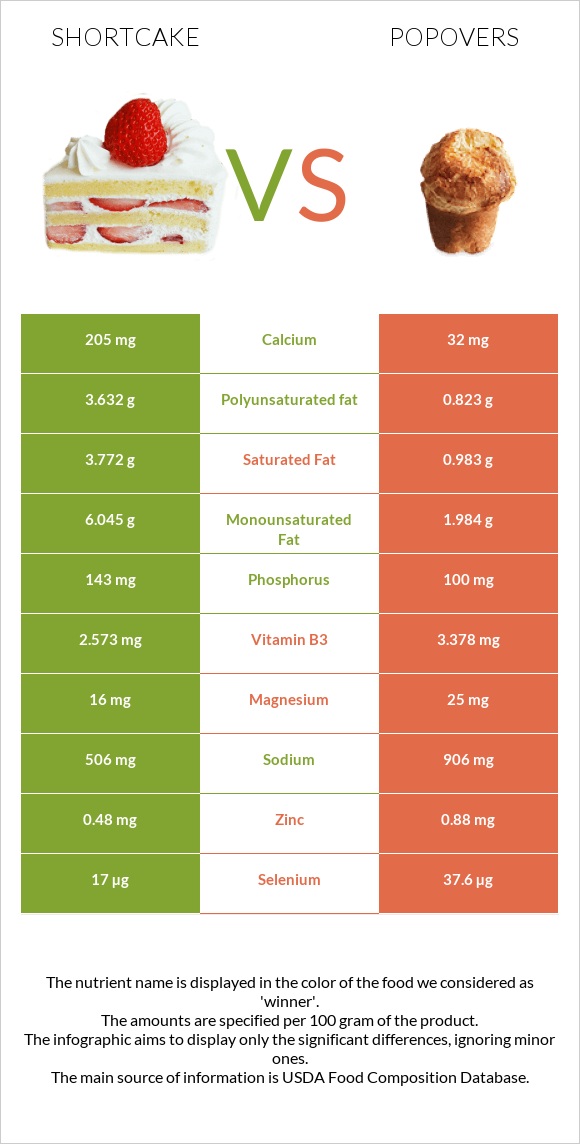
A recap on the differences between shortcake and popovers Shortcake is higher in calcium, vitamin B2, and phosphorus, yet popovers are higher in selenium, folate, manganese, copper, and vitamin B1. Popovers cover your daily selenium needs 37% more than shortcake. Shortcake contains 6 times more calcium than popovers. While shortcake contains 205mg of calcium, popovers contain only 32mg. The amount of saturated fat in popovers is lower. Food varieties used in this article are Cake, shortcake, biscuit-type, prepared from recipe and Popovers, dry mix, enriched .
Infographic
Mineral Comparison
Mineral comparison score is based on the number of minerals by which one or the other food is richer. The "coverage" charts below show how much of the daily needs can be covered by 300 grams of the food.
3
100 g
300 g
1 oz - 28.35g
Magnesium
Magnesium
Calcium
Calcium
Potassium
Potassium
Iron
Iron
Copper
Copper
Zinc
Zinc
Phosphorus
Phosphorus
Sodium
Sodium
Manganese
Manganese
Selenium
Selenium
11%
62%
9.4%
95%
25%
13%
61%
66%
43%
93%
6
100 g
300 g
1 oz - 28.35g 1 package (6 oz) - 170g
Magnesium
Magnesium
Calcium
Calcium
Potassium
Potassium
Iron
Iron
Copper
Copper
Zinc
Zinc
Phosphorus
Phosphorus
Sodium
Sodium
Manganese
Manganese
Selenium
Selenium
18%
9.6%
8.8%
111%
57%
24%
43%
118%
97%
205%
Vitamin Comparison
Vitamin comparison score is based on the number of vitamins by which one or the other food is richer. The "coverage" charts below show how much of the daily needs can be covered by 300 grams of the food.
3
100 g
300 g
1 oz - 28.35g
Vitamin C
Vit. C
Vitamin D
Vit. D
Vitamin A
Vit. A
Vitamin E
Vit. E
Vitamin B1
Vit. B1
Vitamin B2
Vit. B2
Vitamin B3
Vit. B3
Vitamin B5
Vit. B5
Vitamin B6
Vit. B6
Vitamin B12
Vit. B12
Vitamin K
Vit. K
Folate
Folate
0.67%
0%
6%
0%
78%
63%
48%
15%
6.9%
8.8%
0%
40%
6
100 g
300 g
1 oz - 28.35g 1 package (6 oz) - 170g
Vitamin C
Vit. C
Vitamin D
Vit. D
Vitamin A
Vit. A
Vitamin E
Vit. E
Vitamin B1
Vit. B1
Vitamin B2
Vit. B2
Vitamin B3
Vit. B3
Vitamin B5
Vit. B5
Vitamin B6
Vit. B6
Vitamin B12
Vit. B12
Vitamin K
Vit. K
Folate
Folate
0.33%
0%
0%
0%
108%
34%
63%
29%
9.7%
10%
0%
109%
All nutrients comparison - raw data values
Nutrient
DV% diff.
Selenium
17µg
37.6µg
37%
Folate
53µg
145µg
23%
Polyunsaturated fat
3.632g
0.823g
19%
Manganese
0.33mg
0.741mg
18%
Calcium
205mg
32mg
17%
Sodium
506mg
906mg
17%
Fats
14.2g
4.3g
15%
Saturated fat
3.772g
0.983g
13%
Copper
0.076mg
0.171mg
11%
Vitamin B1
0.311mg
0.43mg
10%
Vitamin B2
0.272mg
0.147mg
10%
Monounsaturated fat
6.045g
1.984g
10%
Protein
6.1g
10.4g
9%
Carbs
48.5g
71g
8%
Phosphorus
143mg
100mg
6%
Iron
2.54mg
2.97mg
5%
Vitamin B3
2.573mg
3.378mg
5%
Vitamin B5
0.248mg
0.48mg
5%
Zinc
0.48mg
0.88mg
4%
Magnesium
16mg
25mg
2%
Vitamin A
18µg
0µg
2%
Calories
346kcal
371kcal
1%
Cholesterol
3mg
0mg
1%
Vitamin B6
0.03mg
0.042mg
1%
Protein per 100 calories
1.8g
2.8g
N/A
Calories per 10 g protein
567kcal
357kcal
N/A
Weight per 100 calories
29g
27g
N/A
Unsaturated / Saturated Fat ratio
2.6
2.9
N/A
Vitamin C
0.2mg
0.1mg
0%
Net carbs
48.5g
71g
N/A
Potassium
106mg
100mg
0%
Vitamin B12
0.07µg
0.08µg
0%
Tryptophan
0.076mg
0.123mg
0%
Threonine
0.184mg
0.293mg
0%
Isoleucine
0.238mg
0.407mg
0%
Leucine
0.449mg
0.747mg
0%
Lysine
0.197mg
0.249mg
0%
Methionine
0.115mg
0.191mg
0%
Phenylalanine
0.302mg
0.517mg
0%
Valine
0.273mg
0.458mg
0%
Histidine
0.14mg
0.229mg
0%
Macronutrient Comparison
Macronutrient breakdown side-by-side comparison
3
6%
14%
49%
28%
3%
Protein:
6.1 g
Fats:
14.2 g
Carbs:
48.5 g
Water:
28.4 g
Other:
2.8 g
2
10%
4%
71%
12%
3%
Protein:
10.4 g
Fats:
4.3 g
Carbs:
71 g
Water:
11.7 g
Other:
2.6 g
Contains
more
Fats Fats
+230.2%
Contains
more
Water Water
+142.7%
Contains
more
Protein Protein
+70.5%
Contains
more
Carbs Carbs
+46.4%
Fat Type Comparison
Fat type breakdown side-by-side comparison
2
28%
45%
27%
Saturated fat:
Sat. Fat
3.772 g
Monounsaturated fat:
Mono. Fat
6.045 g
Polyunsaturated fat:
Poly. Fat
3.632 g
1
26%
52%
22%
Saturated fat:
Sat. Fat
0.983 g
Monounsaturated fat:
Mono. Fat
1.984 g
Polyunsaturated fat:
Poly. Fat
0.823 g
Contains
more
Mono. Fat Monounsaturated fat
+204.7%
Contains
more
Poly. Fat Polyunsaturated fat
+341.3%
Contains
less
Sat. Fat Saturated fat
-73.9%