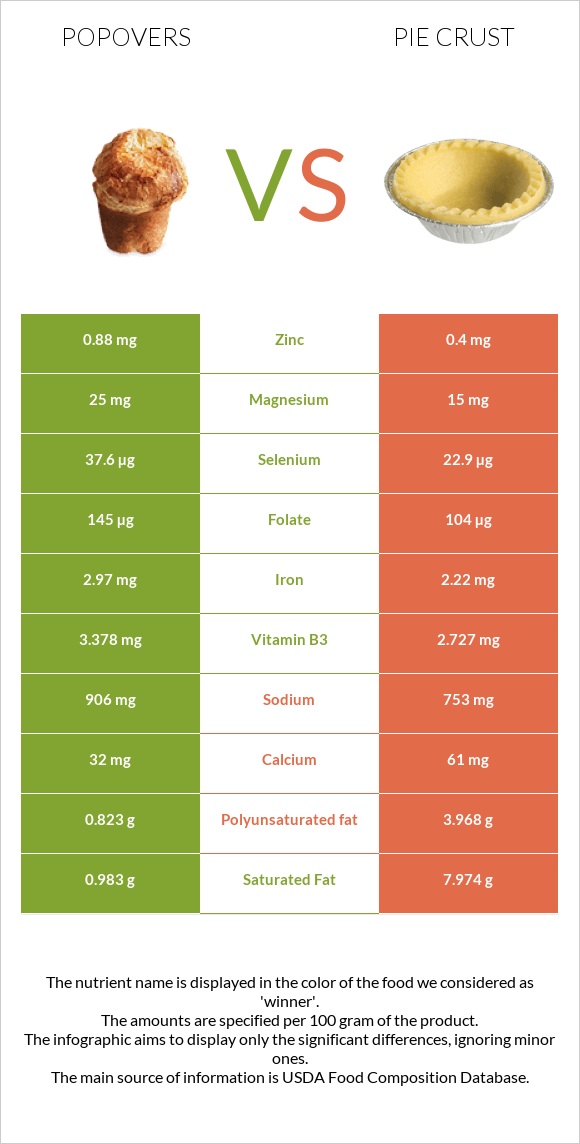
Differences between popovers and pie crust Popovers have more selenium, manganese, copper, folate, and iron, while pie crust has more vitamin B2. Pie crust's daily need coverage for saturated fat is 35% higher. Pie crust contains 2 times less manganese than popovers. Popovers contain 0.741mg of manganese, while pie crust contains 0.315mg. The amount of sodium in pie crust is lower. The food types used in this comparison are Popovers, dry mix, enriched and Pie crust, standard-type, dry mix .
Infographic
Mineral Comparison
Mineral comparison score is based on the number of minerals by which one or the other food is richer. The "coverage" charts below show how much of the daily needs can be covered by 300 grams of the food.
8
100 g
300 g
1 oz - 28.35g 1 package (6 oz) - 170g
Magnesium
Magnesium
Calcium
Calcium
Potassium
Potassium
Iron
Iron
Copper
Copper
Zinc
Zinc
Phosphorus
Phosphorus
Sodium
Sodium
Manganese
Manganese
Selenium
Selenium
18%
9.6%
8.8%
111%
57%
24%
43%
118%
97%
205%
2
100 g
300 g
1 oz - 28.35g 1 package (10 oz) - 284g
Magnesium
Magnesium
Calcium
Calcium
Potassium
Potassium
Iron
Iron
Copper
Copper
Zinc
Zinc
Phosphorus
Phosphorus
Sodium
Sodium
Manganese
Manganese
Selenium
Selenium
11%
18%
5.6%
83%
25%
11%
37%
98%
41%
125%
Vitamin Comparison
Vitamin comparison score is based on the number of vitamins by which one or the other food is richer. The "coverage" charts below show how much of the daily needs can be covered by 300 grams of the food.
5
100 g
300 g
1 oz - 28.35g 1 package (6 oz) - 170g
Vitamin C
Vit. C
Vitamin D
Vit. D
Vitamin A
Vit. A
Vitamin E
Vit. E
Vitamin B1
Vit. B1
Vitamin B2
Vit. B2
Vitamin B3
Vit. B3
Vitamin B5
Vit. B5
Vitamin B6
Vit. B6
Vitamin B12
Vit. B12
Vitamin K
Vit. K
Folate
Folate
0.33%
0%
0%
0%
108%
34%
63%
29%
9.7%
10%
0%
109%
2
100 g
300 g
1 oz - 28.35g 1 package (10 oz) - 284g
Vitamin C
Vit. C
Vitamin D
Vit. D
Vitamin A
Vit. A
Vitamin E
Vit. E
Vitamin B1
Vit. B1
Vitamin B2
Vit. B2
Vitamin B3
Vit. B3
Vitamin B5
Vit. B5
Vitamin B6
Vit. B6
Vitamin B12
Vit. B12
Vitamin K
Vit. K
Folate
Folate
0%
0%
0%
0%
98%
49%
51%
16%
15%
0%
0%
78%
All nutrients comparison - raw data values
Nutrient
DV% diff.
Fats
4.3g
31.4g
42%
Monounsaturated fat
1.984g
17.887g
40%
Saturated fat
0.983g
7.974g
32%
Selenium
37.6µg
22.9µg
27%
Polyunsaturated fat
0.823g
3.968g
21%
Manganese
0.741mg
0.315mg
19%
Copper
0.171mg
0.075mg
11%
Folate
145µg
104µg
10%
Iron
2.97mg
2.22mg
9%
Calories
371kcal
518kcal
7%
Protein
10.4g
6.9g
7%
Sodium
906mg
753mg
7%
Carbs
71g
52.1g
6%
Vitamin B2
0.147mg
0.213mg
5%
Zinc
0.88mg
0.4mg
4%
Vitamin B3
3.378mg
2.727mg
4%
Vitamin B5
0.48mg
0.268mg
4%
Calcium
32mg
61mg
3%
Vitamin B1
0.43mg
0.392mg
3%
Vitamin B12
0.08µg
0µg
3%
Magnesium
25mg
15mg
2%
Phosphorus
100mg
86mg
2%
Vitamin B6
0.042mg
0.064mg
2%
Potassium
100mg
64mg
1%
Protein per 100 calories
2.8g
1.3g
N/A
Calories per 10 g protein
357kcal
751kcal
N/A
Weight per 100 calories
27g
19g
N/A
Unsaturated / Saturated Fat ratio
2.9
2.7
N/A
Vitamin C
0.1mg
0mg
0%
Net carbs
71g
52.1g
N/A
Tryptophan
0.123mg
0.08mg
0%
Threonine
0.293mg
0.184mg
0%
Isoleucine
0.407mg
0.255mg
0%
Leucine
0.747mg
0.476mg
0%
Lysine
0.249mg
0.133mg
0%
Methionine
0.191mg
0.121mg
0%
Phenylalanine
0.517mg
0.339mg
0%
Valine
0.458mg
0.289mg
0%
Histidine
0.229mg
0.146mg
0%
Macronutrient Comparison
Macronutrient breakdown side-by-side comparison
4
10%
4%
71%
12%
3%
Protein:
10.4 g
Fats:
4.3 g
Carbs:
71 g
Water:
11.7 g
Other:
2.6 g
1
7%
31%
52%
8%
2%
Protein:
6.9 g
Fats:
31.4 g
Carbs:
52.1 g
Water:
7.6 g
Other:
2 g
Contains
more
Protein Protein
+50.7%
Contains
more
Carbs Carbs
+36.3%
Contains
more
Water Water
+53.9%
Contains
more
Other Other
+30%
Contains
more
Fats Fats
+630.2%
Fat Type Comparison
Fat type breakdown side-by-side comparison
1
26%
52%
22%
Saturated fat:
Sat. Fat
0.983 g
Monounsaturated fat:
Mono. Fat
1.984 g
Polyunsaturated fat:
Poly. Fat
0.823 g
2
27%
60%
13%
Saturated fat:
Sat. Fat
7.974 g
Monounsaturated fat:
Mono. Fat
17.887 g
Polyunsaturated fat:
Poly. Fat
3.968 g
Contains
less
Sat. Fat Saturated fat
-87.7%
Contains
more
Mono. Fat Monounsaturated fat
+801.6%
Contains
more
Poly. Fat Polyunsaturated fat
+382.1%