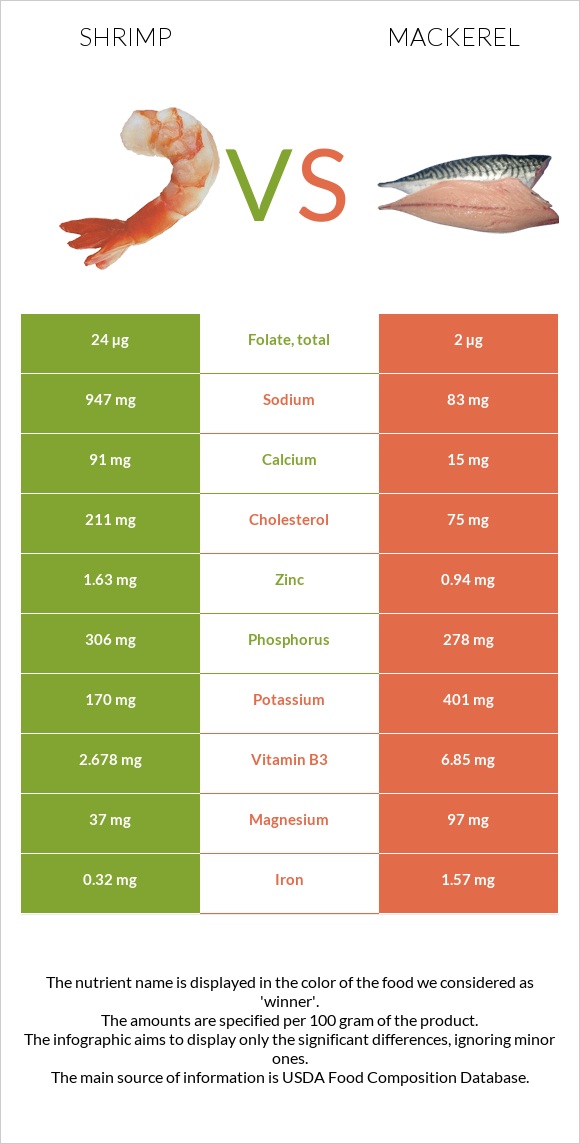
How are shrimp and mackerel different? Shrimp is richer in copper, while mackerel is higher in vitamin B12, vitamin B2, vitamin B3, vitamin B6, iron, and magnesium. Mackerel covers your daily need for vitamin B12, 723% more than shrimp. Shrimp contains 11 times more sodium than mackerel. Shrimp contains 947mg of sodium, while mackerel contains 83mg. Shrimp has a higher glycemic index (50) than mackerel (0). Crustaceans, shrimp, mixed species, cooked, moist heat (may have been previously frozen) and Fish, mackerel, Atlantic, cooked, dry heat types were used in this article.
Infographic
Mineral Comparison
Mineral comparison score is based on the number of minerals by which one or the other food is richer. The "coverage" charts below show how much of the daily needs can be covered by 300 grams of the food.
4
100 g
300 g
4 large - 22g 3 oz - 85g
Magnesium
Magnesium
Calcium
Calcium
Potassium
Potassium
Iron
Iron
Copper
Copper
Zinc
Zinc
Phosphorus
Phosphorus
Sodium
Sodium
Manganese
Manganese
Selenium
Selenium
26%
27%
15%
12%
86%
44%
131%
124%
6.4%
270%
4
100 g
300 g
3 oz - 85g 1 fillet - 88g
Magnesium
Magnesium
Calcium
Calcium
Potassium
Potassium
Iron
Iron
Copper
Copper
Zinc
Zinc
Phosphorus
Phosphorus
Sodium
Sodium
Manganese
Manganese
Selenium
Selenium
69%
4.5%
35%
59%
31%
26%
119%
11%
2.6%
281%
Vitamin Comparison
Vitamin comparison score is based on the number of vitamins by which one or the other food is richer. The "coverage" charts below show how much of the daily needs can be covered by 300 grams of the food.
5
100 g
300 g
4 large - 22g 3 oz - 85g
Vitamin C
Vit. C
Vitamin D
Vit. D
Vitamin A
Vit. A
Vitamin E
Vit. E
Vitamin B1
Vit. B1
Vitamin B2
Vit. B2
Vitamin B3
Vit. B3
Vitamin B5
Vit. B5
Vitamin B6
Vit. B6
Vitamin B12
Vit. B12
Vitamin K
Vit. K
Folate
Folate
0%
1.5%
30%
44%
8%
5.5%
50%
31%
56%
208%
1%
18%
7
100 g
300 g
3 oz - 85g 1 fillet - 88g
Vitamin C
Vit. C
Vitamin D
Vit. D
Vitamin A
Vit. A
Vitamin E
Vit. E
Vitamin B1
Vit. B1
Vitamin B2
Vit. B2
Vitamin B3
Vit. B3
Vitamin B5
Vit. B5
Vitamin B6
Vit. B6
Vitamin B12
Vit. B12
Vitamin K
Vit. K
Folate
Folate
1.3%
0%
18%
0%
40%
95%
128%
59%
106%
2375%
0%
1.5%
All nutrients comparison - raw data values
Nutrient
DV% diff.
Vitamin B12
1.66µg
19µg
723%
Cholesterol
211mg
75mg
45%
Sodium
947mg
83mg
38%
Vitamin B2
0.024mg
0.412mg
30%
Vitamin B3
2.678mg
6.85mg
26%
Fats
1.7g
17.81g
25%
Choline
135.4mg
25%
Polyunsaturated fat
0.59g
4.3g
25%
Copper
0.258mg
0.094mg
18%
Vitamin B6
0.242mg
0.46mg
17%
Saturated fat
0.521g
4.176g
17%
Monounsaturated fat
0.361g
7.006g
17%
Iron
0.32mg
1.57mg
16%
Vitamin E
2.2mg
15%
Magnesium
37mg
97mg
14%
Vitamin B1
0.032mg
0.159mg
11%
Vitamin B5
0.519mg
0.99mg
9%
Calcium
91mg
15mg
8%
Calories
119kcal
262kcal
7%
Potassium
170mg
401mg
7%
Zinc
1.63mg
0.94mg
6%
Folate
24µg
2µg
6%
Phosphorus
306mg
278mg
4%
Vitamin A
90µg
54µg
4%
Selenium
49.5µg
51.6µg
4%
Protein
22.78g
23.85g
2%
Carbs
1.52g
0g
1%
Vitamin D*
4 IU
1%
Vitamin D
0.1µg
1%
Manganese
0.049mg
0.02mg
1%
Protein per 100 calories
19g
9.1g
N/A
Calories per 10 g protein
52kcal
110kcal
N/A
Weight per 100 calories
84g
38g
N/A
Unsaturated / Saturated Fat ratio
1.8
2.7
N/A
Vitamin C
0mg
0.4mg
0%
Net carbs
1.52g
0g
N/A
Vitamin K
0.4µg
0%
Trans fat
0.035g
N/A
Tryptophan
0.26mg
0.267mg
0%
Threonine
0.904mg
1.045mg
0%
Isoleucine
1.05mg
1.099mg
0%
Leucine
1.95mg
1.938mg
0%
Lysine
2.172mg
2.19mg
0%
Methionine
0.665mg
0.706mg
0%
Phenylalanine
0.992mg
0.931mg
0%
Valine
1.067mg
1.228mg
0%
Histidine
0.501mg
0.702mg
0%
Omega-3 - EPA
0.135g
0.504g
N/A
Omega-3 - DHA
0.141g
0.699g
N/A
Omega-3 - DPA
0.012g
0.106g
N/A
Omega-6 - Eicosadienoic acid
0.012g
N/A
Macronutrient Comparison
Macronutrient breakdown side-by-side comparison
2
23%
2%
72%
2%
Protein:
22.78 g
Fats:
1.7 g
Carbs:
1.52 g
Water:
71.56 g
Other:
2.44 g
3
24%
18%
53%
5%
Protein:
23.85 g
Fats:
17.81 g
Carbs:
0 g
Water:
53.27 g
Other:
5.07 g
Contains
more
Carbs Carbs
+∞%
Contains
more
Water Water
+34.3%
Contains
more
Fats Fats
+947.6%
Contains
more
Other Other
+107.8%
~equal in
Protein
~23.85g
Fat Type Comparison
Fat type breakdown side-by-side comparison
1
35%
25%
40%
Saturated fat:
Sat. Fat
0.521 g
Monounsaturated fat:
Mono. Fat
0.361 g
Polyunsaturated fat:
Poly. Fat
0.59 g
2
27%
45%
28%
Saturated fat:
Sat. Fat
4.176 g
Monounsaturated fat:
Mono. Fat
7.006 g
Polyunsaturated fat:
Poly. Fat
4.3 g
Contains
less
Sat. Fat Saturated fat
-87.5%
Contains
more
Mono. Fat Monounsaturated fat
+1840.7%
Contains
more
Poly. Fat Polyunsaturated fat
+628.8%