Skittles vs. Reeses cups — In-Depth Nutrition Comparison
Compare
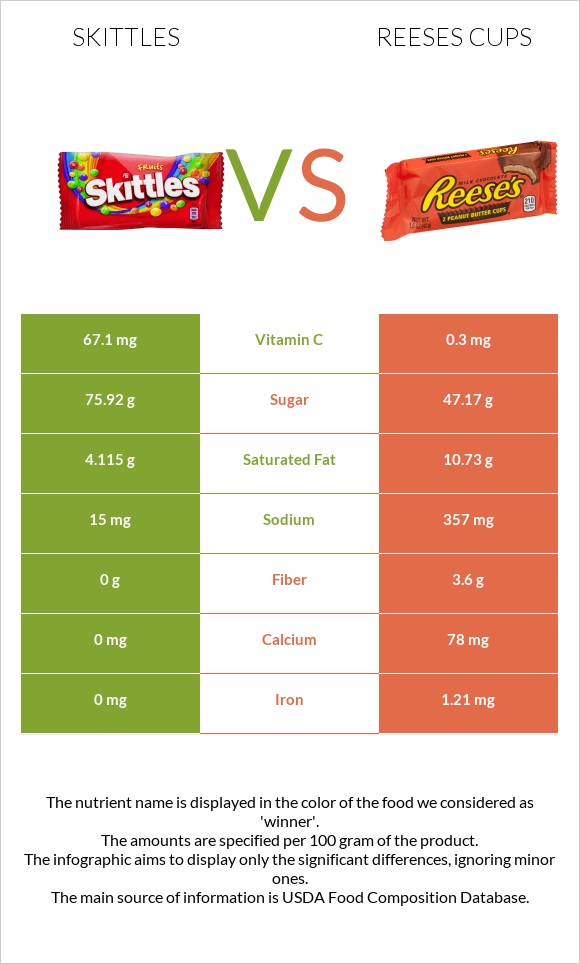
Summary of differences between skittles and reeses cups
- Skittles have more vitamin C, while reeses cups have more iron, fiber, and calcium.
- Skittles cover your daily need for vitamin C, 74% more than reeses cups.
- Skittles contain 2 times more sugar than reeses cups. While skittles contain 75.92g of sugar, reeses cups contain only 47.17g.
These are the specific foods used in this comparison Candies, MARS SNACKFOOD US, SKITTLES Wild Berry Bite Size Candies and Candies, REESE'S Peanut Butter Cups.
Infographic
Infographic link
Mineral Comparison
Mineral comparison score is based on the number of minerals by which one or the other food is richer. The "coverage" charts below show how much of the daily needs can be covered by 300 grams of the food.
| Contains less SodiumSodium | -95.8% |
| Contains more CalciumCalcium | +∞% |
| Contains more IronIron | +∞% |
Vitamin Comparison
Vitamin comparison score is based on the number of vitamins by which one or the other food is richer. The "coverage" charts below show how much of the daily needs can be covered by 300 grams of the food.
| Contains more Vitamin CVitamin C | +22266.7% |
| Contains more Vitamin AVitamin A | +∞% |
All nutrients comparison - raw data values
| Nutrient |  |
 |
DV% diff. |
| Vitamin C | 67.1mg | 0.3mg | 74% |
| Fats | 4.25g | 30.53g | 40% |
| Polyunsaturated fat | 5.5g | 37% | |
| Monounsaturated fat | 13.1g | 33% | |
| Saturated fat | 4.115g | 10.73g | 30% |
| Vitamin B3 | 4.49mg | 28% | |
| Copper | 0.24mg | 27% | |
| Phosphorus | 161mg | 23% | |
| Protein | 0.19g | 10.24g | 20% |
| Magnesium | 62mg | 15% | |
| Iron | 0mg | 1.21mg | 15% |
| Sodium | 15mg | 357mg | 15% |
| Fiber | 0g | 3.6g | 14% |
| Vitamin B1 | 0.16mg | 13% | |
| Folate | 50µg | 13% | |
| Carbs | 90.76g | 55.36g | 12% |
| Zinc | 1.28mg | 12% | |
| Vitamin B5 | 0.62mg | 12% | |
| Vitamin B12 | 0.26µg | 11% | |
| Potassium | 343mg | 10% | |
| Calcium | 0mg | 78mg | 8% |
| Vitamin B2 | 0.11mg | 8% | |
| Vitamin B6 | 0.1mg | 8% | |
| Calories | 402kcal | 515kcal | 6% |
| Choline | 35.4mg | 6% | |
| Selenium | 1.4µg | 3% | |
| Cholesterol | 0mg | 6mg | 2% |
| Vitamin A | 0µg | 17µg | 2% |
| Vitamin K | 2µg | 2% | |
| Caffeine | 7mg | 2% | |
| Vitamin E | 0.15mg | 1% | |
| Net carbs | 90.76g | 51.76g | N/A |
| Sugar | 75.92g | 47.17g | N/A |
| Trans fat | 0.074g | 0g | N/A |
Macronutrient Comparison
Macronutrient breakdown side-by-side comparison
Protein:
0.19 g
Fats:
4.25 g
Carbs:
90.76 g
Water:
3.83 g
Other:
0.97 g
Protein:
10.24 g
Fats:
30.53 g
Carbs:
55.36 g
Water:
1.44 g
Other:
2.43 g
| Contains more CarbsCarbs | +63.9% |
| Contains more WaterWater | +166% |
| Contains more ProteinProtein | +5289.5% |
| Contains more FatsFats | +618.4% |
| Contains more OtherOther | +150.5% |
Fat Type Comparison
Fat type breakdown side-by-side comparison
Saturated fat:
Sat. Fat
4.115 g
Monounsaturated fat:
Mono. Fat
0 g
Polyunsaturated fat:
Poly. Fat
0 g
Saturated fat:
Sat. Fat
10.73 g
Monounsaturated fat:
Mono. Fat
13.1 g
Polyunsaturated fat:
Poly. Fat
5.5 g
| Contains less Sat. FatSaturated fat | -61.6% |


