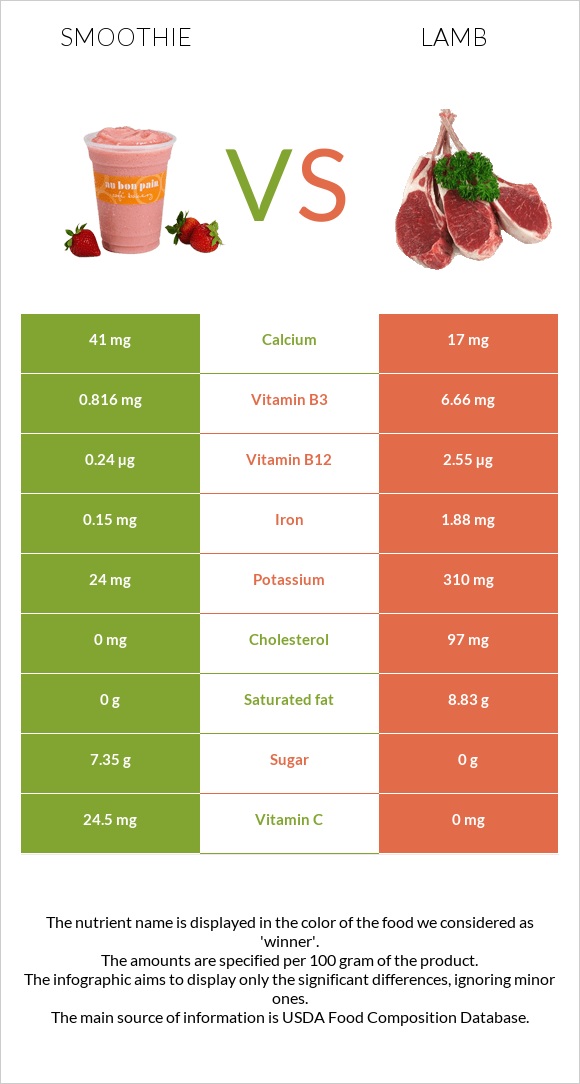
How are smoothie and lamb different? Smoothie is higher in vitamin C and vitamin A; however, lamb is richer in vitamin B12, vitamin B3, iron, and potassium. Daily need coverage for vitamin B12 for lamb is 96% higher. Lamb has less sugar. Lamb has a lower glycemic index (0) than smoothie (44). Beverages, V8 SPLASH Smoothies, Strawberry Banana and Lamb, domestic, composite of trimmed retail cuts, separable lean, and fat, trimmed to 1/4" fat, choice, cooked are the varieties used in this article.
Infographic
Mineral Comparison
Mineral comparison score is based on the number of minerals by which one or the other food is richer. The "coverage" charts below show how much of the daily needs can be covered by 300 grams of the food.
2
100 g
300 g
1 serving 8 oz - 245g
Magnesium
Magnesium
Calcium
Calcium
Potassium
Potassium
Iron
Iron
Copper
Copper
Zinc
Zinc
Phosphorus
Phosphorus
Sodium
Sodium
Manganese
Manganese
Selenium
Selenium
0%
12%
2.1%
5.6%
0%
0%
0%
3.8%
0%
0%
8
100 g
300 g
3 oz - 85g
Magnesium
Magnesium
Calcium
Calcium
Potassium
Potassium
Iron
Iron
Copper
Copper
Zinc
Zinc
Phosphorus
Phosphorus
Sodium
Sodium
Manganese
Manganese
Selenium
Selenium
16%
5.1%
27%
71%
40%
122%
81%
9.4%
2.9%
144%
Vitamin Comparison
Vitamin comparison score is based on the number of vitamins by which one or the other food is richer. The "coverage" charts below show how much of the daily needs can be covered by 300 grams of the food.
1
100 g
300 g
1 serving 8 oz - 245g
Vitamin C
Vit. C
Vitamin A
Vit. A
Vitamin E
Vit. E
Vitamin D
Vit. D
Vitamin B1
Vit. B1
Vitamin B2
Vit. B2
Vitamin B3
Vit. B3
Vitamin B5
Vit. B5
Vitamin B6
Vit. B6
Vitamin B12
Vit. B12
Vitamin K
Vit. K
Folate
Folate
82%
0%
0%
0%
0%
0%
15%
0%
19%
30%
0%
0%
10
100 g
300 g
3 oz - 85g
Vitamin C
Vit. C
Vitamin A
Vit. A
Vitamin E
Vit. E
Vitamin D
Vit. D
Vitamin B1
Vit. B1
Vitamin B2
Vit. B2
Vitamin B3
Vit. B3
Vitamin B5
Vit. B5
Vitamin B6
Vit. B6
Vitamin B12
Vit. B12
Vitamin K
Vit. K
Folate
Folate
0%
0%
2.8%
1.5%
25%
58%
125%
40%
30%
319%
12%
14%
All nutrients comparison - raw data values
Macronutrient Comparison
Macronutrient breakdown side-by-side comparison
2
8%
90%
Protein:
1.22 g
Fats:
0 g
Carbs:
8.16 g
Water:
90.28 g
Other:
0.34 g
3
25%
21%
54%
Protein:
24.52 g
Fats:
20.94 g
Carbs:
0 g
Water:
53.72 g
Other:
0.82 g
Contains
more
Carbs Carbs
+∞%
Contains
more
Water Water
+68.1%
Contains
more
Protein Protein
+1909.8%
Contains
more
Fats Fats
+∞%
Contains
more
Other Other
+141.2%