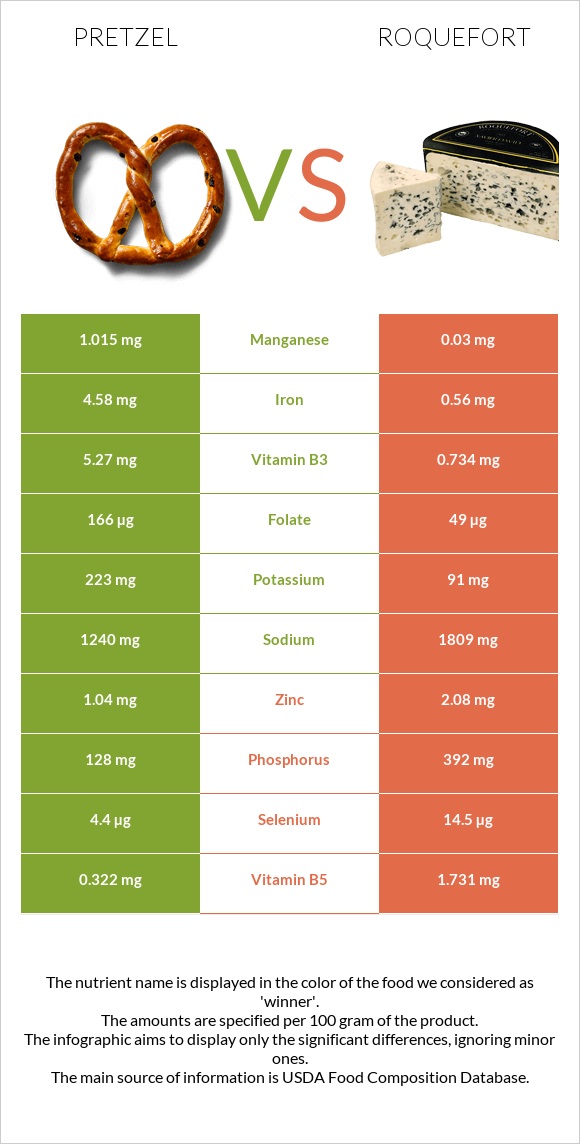
What are the main differences between pretzel and roquefort? Pretzel is richer in iron, manganese, vitamin B1, folate, and vitamin B3, while roquefort is higher in calcium, phosphorus, and vitamin B5. Roquefort's daily need coverage for saturated fat is 94% higher. Roquefort has 34 times less manganese than pretzel. Pretzel has 1.015mg of manganese, while roquefort has 0.03mg. Pretzel is lower in saturated fat. Pretzel has a higher glycemic index (83) than roquefort (27). We used Snacks, pretzels, hard, plain, salted and Cheese, roquefort types in this comparison.
Infographic
Mineral Comparison
Mineral comparison score is based on the number of minerals by which one or the other food is richer. The "coverage" charts below show how much of the daily needs can be covered by 300 grams of the food.
5
100 g
300 g
1 oz - 28.35g 10 twists - 60g
Magnesium
Magnesium
Calcium
Calcium
Potassium
Potassium
Iron
Iron
Copper
Copper
Zinc
Zinc
Phosphorus
Phosphorus
Sodium
Sodium
Manganese
Manganese
Selenium
Selenium
21%
8.1%
20%
172%
52%
28%
55%
162%
132%
24%
4
100 g
300 g
1 oz - 28.35g 1 package (3 oz) - 85g
Magnesium
Magnesium
Calcium
Calcium
Potassium
Potassium
Iron
Iron
Copper
Copper
Zinc
Zinc
Phosphorus
Phosphorus
Sodium
Sodium
Manganese
Manganese
Selenium
Selenium
21%
199%
8%
21%
11%
57%
168%
236%
3.9%
79%
Vitamin Comparison
Vitamin comparison score is based on the number of vitamins by which one or the other food is richer. The "coverage" charts below show how much of the daily needs can be covered by 300 grams of the food.
6
100 g
300 g
1 oz - 28.35g 10 twists - 60g
Vitamin C
Vit. C
Vitamin D
Vit. D
Vitamin A
Vit. A
Vitamin E
Vit. E
Vitamin B1
Vit. B1
Vitamin B2
Vit. B2
Vitamin B3
Vit. B3
Vitamin B5
Vit. B5
Vitamin B6
Vit. B6
Vitamin B12
Vit. B12
Vitamin K
Vit. K
Folate
Folate
7%
0%
0%
9.4%
106%
77%
99%
19%
17%
0%
7%
125%
5
100 g
300 g
1 oz - 28.35g 1 package (3 oz) - 85g
Vitamin C
Vit. C
Vitamin D
Vit. D
Vitamin A
Vit. A
Vitamin E
Vit. E
Vitamin B1
Vit. B1
Vitamin B2
Vit. B2
Vitamin B3
Vit. B3
Vitamin B5
Vit. B5
Vitamin B6
Vit. B6
Vitamin B12
Vit. B12
Vitamin K
Vit. K
Folate
Folate
0%
0%
98%
0%
10%
135%
14%
104%
29%
80%
0%
37%
All nutrients comparison - raw data values
Nutrient
DV% diff.
Saturated fat
0.391g
19.263g
86%
Calcium
27mg
662mg
64%
Iron
4.58mg
0.56mg
50%
Fats
2.93g
30.64g
43%
Manganese
1.015mg
0.03mg
43%
Phosphorus
128mg
392mg
38%
Vitamin A
0µg
294µg
33%
Vitamin B1
0.424mg
0.04mg
32%
Cholesterol
0mg
90mg
30%
Starch
72.58g
30%
Folate
166µg
49µg
29%
Vitamin B3
5.27mg
0.734mg
28%
Vitamin B5
0.322mg
1.731mg
28%
Vitamin B12
0µg
0.64µg
27%
Carbs
80.39g
2g
26%
Sodium
1240mg
1809mg
25%
Protein
10.04g
21.54g
23%
Vitamin B2
0.332mg
0.586mg
20%
Monounsaturated fat
0.727g
8.474g
19%
Selenium
4.4µg
14.5µg
18%
Fiber
3.4g
0g
14%
Copper
0.156mg
0.034mg
14%
Zinc
1.04mg
2.08mg
9%
Choline
29.5mg
5%
Potassium
223mg
91mg
4%
Vitamin B6
0.074mg
0.124mg
4%
Vitamin E
0.47mg
3%
Vitamin C
2.1mg
0mg
2%
Vitamin K
2.8µg
2%
Calories
384kcal
369kcal
1%
Protein per 100 calories
2.6g
5.8g
N/A
Calories per 10 g protein
382kcal
171kcal
N/A
Weight per 100 calories
26g
27g
N/A
Unsaturated / Saturated Fat ratio
5.2
0.51
N/A
Net carbs
76.99g
2g
N/A
Magnesium
29mg
30mg
0%
Sugar
2.21g
N/A
Trans fat
0.004g
N/A
Polyunsaturated fat
1.291g
1.32g
0%
Tryptophan
0.097mg
0.303mg
0%
Threonine
0.25mg
0.965mg
0%
Isoleucine
0.407mg
1.217mg
0%
Leucine
0.757mg
2.114mg
0%
Lysine
0.257mg
1.848mg
0%
Methionine
0.177mg
0.558mg
0%
Phenylalanine
0.52mg
1.023mg
0%
Valine
0.48mg
1.614mg
0%
Histidine
0.22mg
0.602mg
0%
Fructose
0.31g
0%
Omega-3 - ALA
0.063g
N/A
Omega-6 - Gamma-linoleic acid
0.001g
N/A
Omega-6 - Linoleic acid
1.223g
N/A
Macronutrient Comparison
Macronutrient breakdown side-by-side comparison
1
10%
3%
80%
3%
4%
Protein:
10.04 g
Fats:
2.93 g
Carbs:
80.39 g
Water:
3.13 g
Other:
3.51 g
4
22%
31%
2%
39%
6%
Protein:
21.54 g
Fats:
30.64 g
Carbs:
2 g
Water:
39.38 g
Other:
6.44 g
Contains
more
Carbs Carbs
+3919.5%
Contains
more
Protein Protein
+114.5%
Contains
more
Fats Fats
+945.7%
Contains
more
Water Water
+1158.1%
Contains
more
Other Other
+83.5%
Fat Type Comparison
Fat type breakdown side-by-side comparison
1
16%
30%
54%
Saturated fat:
Sat. Fat
0.391 g
Monounsaturated fat:
Mono. Fat
0.727 g
Polyunsaturated fat:
Poly. Fat
1.291 g
2
66%
29%
5%
Saturated fat:
Sat. Fat
19.263 g
Monounsaturated fat:
Mono. Fat
8.474 g
Polyunsaturated fat:
Poly. Fat
1.32 g
Contains
less
Sat. Fat Saturated fat
-98%
Contains
more
Mono. Fat Monounsaturated fat
+1065.6%
~equal in
Polyunsaturated fat
~1.32g