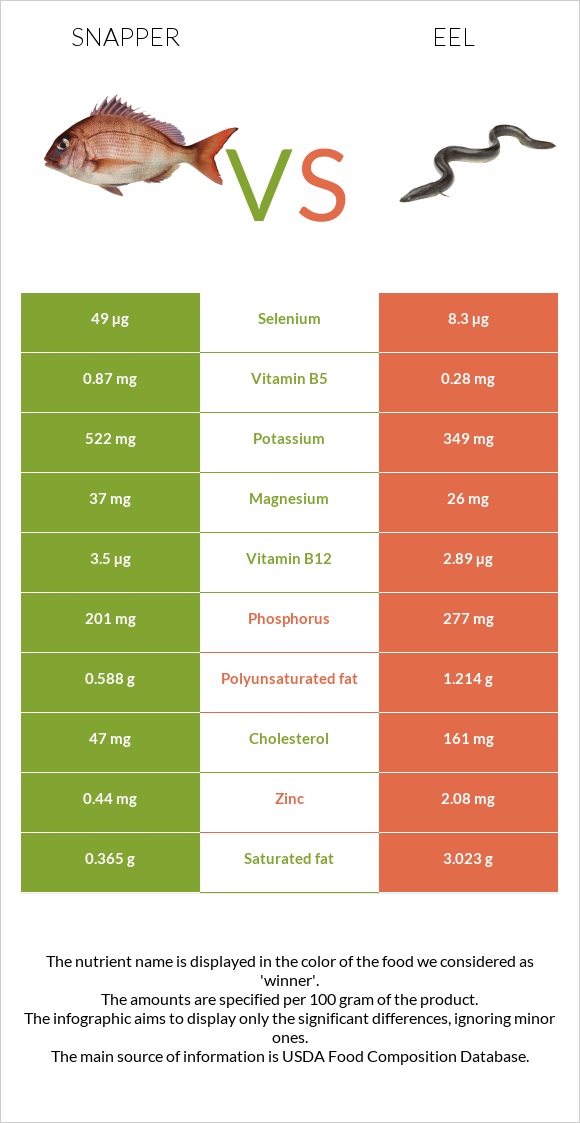
How are snapper and eels different? Snapper is richer in selenium, vitamin B6, vitamin B12, and vitamin B5, while eels are higher in vitamin A, vitamin B3, zinc, and phosphorus. Snapper covers your daily need for selenium, 74% more than eels. Snapper contains 6 times more vitamin B6 than eels. Snapper contains 0.46mg of vitamin B6, while eels contain 0.077mg. Snapper is lower in cholesterol. Fish, snapper, mixed species, cooked, dry heat and Fish, eel, mixed species, cooked, dry heat types were used in this article.
Infographic
Mineral Comparison
Mineral comparison score is based on the number of minerals by which one or the other food is richer. The "coverage" charts below show how much of the daily needs can be covered by 300 grams of the food.
6
100 g
300 g
3 oz - 85g 1 fillet - 170g
Magnesium
Magnesium
Calcium
Calcium
Potassium
Potassium
Iron
Iron
Copper
Copper
Zinc
Zinc
Phosphorus
Phosphorus
Sodium
Sodium
Manganese
Manganese
Selenium
Selenium
26%
12%
46%
9%
15%
12%
86%
7.4%
2.2%
267%
4
100 g
300 g
1 cubic inch, boneless - 17g 1 oz with bone (yield after bone removed) - 22g 1 oz, boneless - 28.35g 3 oz - 85g 1 fillet - 159g
Magnesium
Magnesium
Calcium
Calcium
Potassium
Potassium
Iron
Iron
Copper
Copper
Zinc
Zinc
Phosphorus
Phosphorus
Sodium
Sodium
Manganese
Manganese
Selenium
Selenium
19%
7.8%
31%
24%
9.7%
57%
119%
8.5%
5.2%
45%
Vitamin Comparison
Vitamin comparison score is based on the number of vitamins by which one or the other food is richer. The "coverage" charts below show how much of the daily needs can be covered by 300 grams of the food.
3
100 g
300 g
3 oz - 85g 1 fillet - 170g
Vitamin C
Vit. C
Vitamin D
Vit. D
Vitamin A
Vit. A
Vitamin E
Vit. E
Vitamin B1
Vit. B1
Vitamin B2
Vit. B2
Vitamin B3
Vit. B3
Vitamin B5
Vit. B5
Vitamin B6
Vit. B6
Vitamin B12
Vit. B12
Vitamin K
Vit. K
Folate
Folate
5.3%
0%
12%
0%
13%
0.92%
6.5%
52%
106%
438%
0%
4.5%
6
100 g
300 g
1 cubic inch, boneless - 17g 1 oz with bone (yield after bone removed) - 22g 1 oz, boneless - 28.35g 3 oz - 85g 1 fillet - 159g
Vitamin C
Vit. C
Vitamin D
Vit. D
Vitamin A
Vit. A
Vitamin E
Vit. E
Vitamin B1
Vit. B1
Vitamin B2
Vit. B2
Vitamin B3
Vit. B3
Vitamin B5
Vit. B5
Vitamin B6
Vit. B6
Vitamin B12
Vit. B12
Vitamin K
Vit. K
Folate
Folate
6%
0%
379%
0%
46%
12%
84%
17%
18%
361%
0%
13%
All nutrients comparison - raw data values
Nutrient
DV% diff.
Vitamin A
35µg
1137µg
122%
Selenium
49µg
8.3µg
74%
Cholesterol
47mg
161mg
38%
Vitamin B6
0.46mg
0.077mg
29%
Vitamin B3
0.346mg
4.487mg
26%
Vitamin B12
3.5µg
2.89µg
25%
Monounsaturated fat
0.322g
9.218g
22%
Fats
1.72g
14.95g
20%
Zinc
0.44mg
2.08mg
15%
Vitamin B5
0.87mg
0.28mg
12%
Saturated fat
0.365g
3.023g
12%
Phosphorus
201mg
277mg
11%
Vitamin B1
0.053mg
0.183mg
11%
Calories
128kcal
236kcal
5%
Protein
26.3g
23.65g
5%
Potassium
522mg
349mg
5%
Iron
0.24mg
0.64mg
5%
Vitamin B2
0.004mg
0.051mg
4%
Polyunsaturated fat
0.588g
1.214g
4%
Magnesium
37mg
26mg
3%
Folate
6µg
17µg
3%
Copper
0.046mg
0.029mg
2%
Calcium
40mg
26mg
1%
Manganese
0.017mg
0.04mg
1%
Protein per 100 calories
21g
10g
N/A
Calories per 10 g protein
49kcal
100kcal
N/A
Weight per 100 calories
78g
42g
N/A
Unsaturated / Saturated Fat ratio
2.5
3.5
N/A
Vitamin C
1.6mg
1.8mg
0%
Sodium
57mg
65mg
0%
Tryptophan
0.294mg
0.265mg
0%
Threonine
1.153mg
1.037mg
0%
Isoleucine
1.212mg
1.09mg
0%
Leucine
2.137mg
1.922mg
0%
Lysine
2.415mg
2.171mg
0%
Methionine
0.778mg
0.7mg
0%
Phenylalanine
1.027mg
0.923mg
0%
Valine
1.355mg
1.218mg
0%
Histidine
0.774mg
0.696mg
0%
Omega-3 - EPA
0.048g
0.108g
N/A
Omega-3 - DHA
0.273g
0.081g
N/A
Omega-3 - DPA
0.022g
0.095g
N/A
Macronutrient Comparison
Macronutrient breakdown side-by-side comparison
2
26%
2%
70%
Protein:
26.3 g
Fats:
1.72 g
Carbs:
0 g
Water:
70.35 g
Other:
1.63 g
2
24%
15%
59%
2%
Protein:
23.65 g
Fats:
14.95 g
Carbs:
0 g
Water:
59.31 g
Other:
2.09 g
Contains
more
Protein Protein
+11.2%
Contains
more
Water Water
+18.6%
Contains
more
Fats Fats
+769.2%
Contains
more
Other Other
+28.2%
Fat Type Comparison
Fat type breakdown side-by-side comparison
1
29%
25%
46%
Saturated fat:
Sat. Fat
0.365 g
Monounsaturated fat:
Mono. Fat
0.322 g
Polyunsaturated fat:
Poly. Fat
0.588 g
2
22%
69%
9%
Saturated fat:
Sat. Fat
3.023 g
Monounsaturated fat:
Mono. Fat
9.218 g
Polyunsaturated fat:
Poly. Fat
1.214 g
Contains
less
Sat. Fat Saturated fat
-87.9%
Contains
more
Mono. Fat Monounsaturated fat
+2762.7%
Contains
more
Poly. Fat Polyunsaturated fat
+106.5%