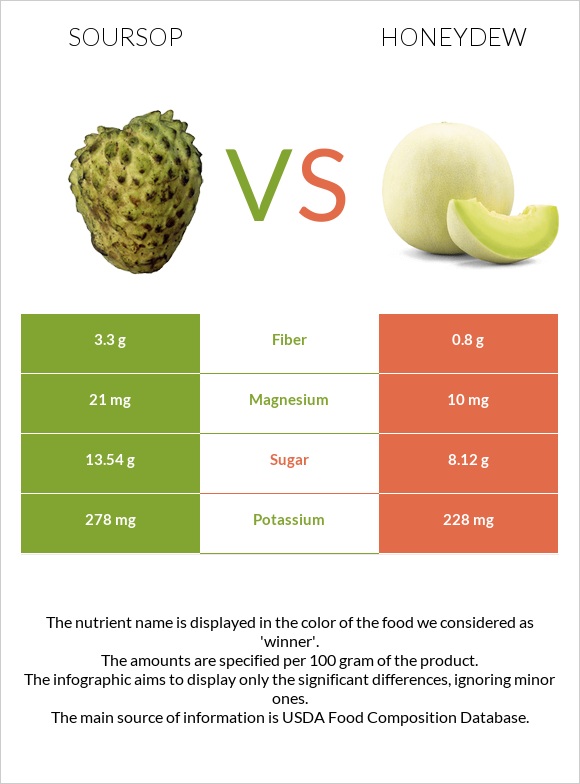
How are soursop and honeydew different? Soursop has more fiber, copper, and iron than honeydew. Soursop contains 4 times more copper than honeydew. While soursop contains 0.086mg of copper, honeydew contains only 0.024mg. Honeydew has less sugar. Soursop has a lower glycemic index (32) than honeydew (62). Soursop, raw and Melons, honeydew, raw are the varieties used in this article.
Infographic
Mineral Comparison
Mineral comparison score is based on the number of minerals by which one or the other food is richer. The "coverage" charts below show how much of the daily needs can be covered by 300 grams of the food.
7
100 g
300 g
1 cup, pulp - 225g 1 fruit (7" x 5-1/4" dia) - 625g
Magnesium
Magnesium
Calcium
Calcium
Potassium
Potassium
Iron
Iron
Copper
Copper
Zinc
Zinc
Phosphorus
Phosphorus
Sodium
Sodium
Manganese
Manganese
Selenium
Selenium
15%
4.2%
25%
23%
29%
2.7%
12%
1.8%
0%
3.3%
2
100 g
300 g
1 wedge (1/8 of 5-1/4" dia melon) - 125g 1 NLEA serving - 134g 10 honeydew balls - 138g 1 wedge (1/8 of 6" to 7" dia melon) - 160g 1 cup, diced (approx 20 pieces per cup) - 170g 1 cup, balls - 177g 1 melon (5-1/4" dia) - 1000g 1 melon (6" - 7" dia) - 1280g
Magnesium
Magnesium
Calcium
Calcium
Potassium
Potassium
Iron
Iron
Copper
Copper
Zinc
Zinc
Phosphorus
Phosphorus
Sodium
Sodium
Manganese
Manganese
Selenium
Selenium
7.1%
1.8%
20%
6.4%
8%
2.5%
4.7%
2.3%
3.5%
3.8%
Vitamin Comparison
Vitamin comparison score is based on the number of vitamins by which one or the other food is richer. The "coverage" charts below show how much of the daily needs can be covered by 300 grams of the food.
6
100 g
300 g
1 cup, pulp - 225g 1 fruit (7" x 5-1/4" dia) - 625g
Vitamin C
Vit. C
Vitamin D
Vit. D
Vitamin A
Vit. A
Vitamin E
Vit. E
Vitamin B1
Vit. B1
Vitamin B2
Vit. B2
Vitamin B3
Vit. B3
Vitamin B5
Vit. B5
Vitamin B6
Vit. B6
Vitamin B12
Vit. B12
Vitamin K
Vit. K
Folate
Folate
69%
0%
0%
1.6%
18%
12%
17%
15%
14%
0%
1%
11%
4
100 g
300 g
1 wedge (1/8 of 5-1/4" dia melon) - 125g 1 NLEA serving - 134g 10 honeydew balls - 138g 1 wedge (1/8 of 6" to 7" dia melon) - 160g 1 cup, diced (approx 20 pieces per cup) - 170g 1 cup, balls - 177g 1 melon (5-1/4" dia) - 1000g 1 melon (6" - 7" dia) - 1280g
Vitamin C
Vit. C
Vitamin D
Vit. D
Vitamin A
Vit. A
Vitamin E
Vit. E
Vitamin B1
Vit. B1
Vitamin B2
Vit. B2
Vitamin B3
Vit. B3
Vitamin B5
Vit. B5
Vitamin B6
Vit. B6
Vitamin B12
Vit. B12
Vitamin K
Vit. K
Folate
Folate
60%
0%
1%
0.4%
9.5%
2.8%
7.8%
9.3%
20%
0%
7.3%
14%
All nutrients comparison - raw data values
Nutrient
DV% diff.
Fiber
3.3g
0.8g
10%
Copper
0.086mg
0.024mg
7%
Iron
0.6mg
0.17mg
5%
Fructose
2.96g
4%
Vitamin C
20.6mg
18mg
3%
Carbs
16.84g
9.09g
3%
Magnesium
21mg
10mg
3%
Vitamin B1
0.07mg
0.038mg
3%
Vitamin B2
0.05mg
0.012mg
3%
Vitamin B3
0.9mg
0.418mg
3%
Calories
66kcal
36kcal
2%
Phosphorus
27mg
11mg
2%
Vitamin B5
0.253mg
0.155mg
2%
Vitamin B6
0.059mg
0.088mg
2%
Vitamin K
0.4µg
2.9µg
2%
Protein
1g
0.54g
1%
Calcium
14mg
6mg
1%
Potassium
278mg
228mg
1%
Manganese
0.027mg
1%
Folate
14µg
19µg
1%
Protein per 100 calories
1.5g
1.5g
N/A
Calories per 10 g protein
660kcal
667kcal
N/A
Weight per 100 calories
152g
278g
N/A
Fats
0.3g
0.14g
0%
Net carbs
13.54g
8.29g
N/A
Sugar
13.54g
8.12g
N/A
Zinc
0.1mg
0.09mg
0%
Sodium
14mg
18mg
0%
Vitamin A
0µg
3µg
0%
Vitamin E
0.08mg
0.02mg
0%
Selenium
0.6µg
0.7µg
0%
Choline
7.6mg
7.6mg
0%
Saturated fat
0.051g
0.038g
0%
Monounsaturated fat
0.09g
0.003g
0%
Polyunsaturated fat
0.069g
0.059g
0%
Tryptophan
0.011mg
0.005mg
0%
Threonine
0.013mg
0%
Isoleucine
0.013mg
0%
Leucine
0.016mg
0%
Lysine
0.06mg
0.018mg
0%
Methionine
0.007mg
0.005mg
0%
Phenylalanine
0.015mg
0%
Valine
0.018mg
0%
Histidine
0.005mg
0%
Macronutrient Comparison
Macronutrient breakdown side-by-side comparison
4
17%
81%
Protein:
1 g
Fats:
0.3 g
Carbs:
16.84 g
Water:
81.16 g
Other:
0.7 g
1
9%
90%
Protein:
0.54 g
Fats:
0.14 g
Carbs:
9.09 g
Water:
89.82 g
Other:
0.41 g
Contains
more
Protein Protein
+85.2%
Contains
more
Fats Fats
+114.3%
Contains
more
Carbs Carbs
+85.3%
Contains
more
Other Other
+70.7%
Contains
more
Water Water
+10.7%
Fat Type Comparison
Fat type breakdown side-by-side comparison
2
24%
43%
33%
Saturated fat:
Sat. Fat
0.051 g
Monounsaturated fat:
Mono. Fat
0.09 g
Polyunsaturated fat:
Poly. Fat
0.069 g
1
38%
3%
59%
Saturated fat:
Sat. Fat
0.038 g
Monounsaturated fat:
Mono. Fat
0.003 g
Polyunsaturated fat:
Poly. Fat
0.059 g
Contains
more
Mono. Fat Monounsaturated fat
+2900%
Contains
more
Poly. Fat Polyunsaturated fat
+16.9%
Contains
less
Sat. Fat Saturated fat
-25.5%