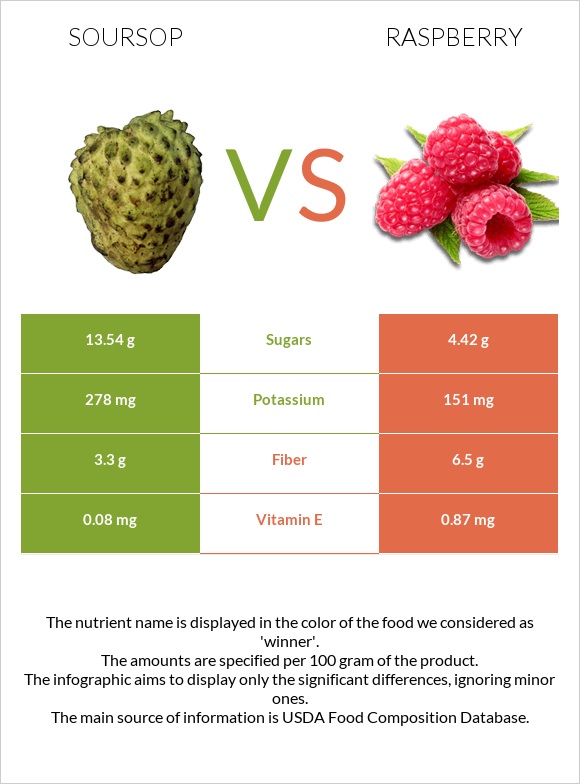
What are the differences between soursop and raspberries? Raspberries are richer than soursop in fiber, vitamin C, vitamin K, and vitamin E. Raspberries' daily need coverage for fiber is 13% more. Soursop has 3 times more sugar than raspberries. While soursop has 13.54g of sugar, raspberries have only 4.42g. We used Soursop, raw and Raspberries, raw types in this article.
Infographic
Mineral Comparison
Mineral comparison score is based on the number of minerals by which one or the other food is richer. The "coverage" charts below show how much of the daily needs can be covered by 300 grams of the food.
2
100 g
300 g
1 cup, pulp - 225g 1 fruit (7" x 5-1/4" dia) - 625g
Magnesium
Magnesium
Calcium
Calcium
Potassium
Potassium
Iron
Iron
Copper
Copper
Zinc
Zinc
Phosphorus
Phosphorus
Sodium
Sodium
Manganese
Manganese
Selenium
Selenium
15%
4.2%
25%
23%
29%
2.7%
12%
1.8%
0%
3.3%
5
100 g
300 g
10 raspberries - 19g 1 cup - 123g 1 pint as purchased, yields - 312g
Magnesium
Magnesium
Calcium
Calcium
Potassium
Potassium
Iron
Iron
Copper
Copper
Zinc
Zinc
Phosphorus
Phosphorus
Sodium
Sodium
Manganese
Manganese
Selenium
Selenium
16%
7.5%
13%
26%
30%
11%
12%
0.13%
87%
1.1%
Vitamin Comparison
Vitamin comparison score is based on the number of vitamins by which one or the other food is richer. The "coverage" charts below show how much of the daily needs can be covered by 300 grams of the food.
3
100 g
300 g
1 cup, pulp - 225g 1 fruit (7" x 5-1/4" dia) - 625g
Vitamin C
Vit. C
Vitamin D
Vit. D
Vitamin A
Vit. A
Vitamin E
Vit. E
Vitamin B1
Vit. B1
Vitamin B2
Vit. B2
Vitamin B3
Vit. B3
Vitamin B5
Vit. B5
Vitamin B6
Vit. B6
Vitamin B12
Vit. B12
Vitamin K
Vit. K
Folate
Folate
69%
0%
0%
1.6%
18%
12%
17%
15%
14%
0%
1%
11%
6
100 g
300 g
10 raspberries - 19g 1 cup - 123g 1 pint as purchased, yields - 312g
Vitamin C
Vit. C
Vitamin D
Vit. D
Vitamin A
Vit. A
Vitamin E
Vit. E
Vitamin B1
Vit. B1
Vitamin B2
Vit. B2
Vitamin B3
Vit. B3
Vitamin B5
Vit. B5
Vitamin B6
Vit. B6
Vitamin B12
Vit. B12
Vitamin K
Vit. K
Folate
Folate
87%
0%
0.67%
17%
8%
8.8%
11%
20%
13%
0%
20%
16%
All nutrients comparison - raw data values
Nutrient
DV% diff.
Manganese
0.67mg
29%
Fiber
3.3g
6.5g
13%
Vitamin C
20.6mg
26.2mg
6%
Vitamin K
0.4µg
7.8µg
6%
Vitamin E
0.08mg
0.87mg
5%
Potassium
278mg
151mg
4%
Zinc
0.1mg
0.42mg
3%
Vitamin B1
0.07mg
0.032mg
3%
Fructose
2.35g
3%
Carbs
16.84g
11.94g
2%
Vitamin B3
0.9mg
0.598mg
2%
Vitamin B5
0.253mg
0.329mg
2%
Folate
14µg
21µg
2%
Polyunsaturated fat
0.069g
0.375g
2%
Calories
66kcal
52kcal
1%
Fats
0.3g
0.65g
1%
Calcium
14mg
25mg
1%
Iron
0.6mg
0.69mg
1%
Sodium
14mg
1mg
1%
Selenium
0.6µg
0.2µg
1%
Vitamin B2
0.05mg
0.038mg
1%
Choline
7.6mg
12.3mg
1%
Protein
1g
1.2g
0%
Protein per 100 calories
1.5g
2.3g
N/A
Calories per 10 g protein
660kcal
433kcal
N/A
Weight per 100 calories
152g
192g
N/A
Net carbs
13.54g
5.44g
N/A
Magnesium
21mg
22mg
0%
Sugar
13.54g
4.42g
N/A
Copper
0.086mg
0.09mg
0%
Phosphorus
27mg
29mg
0%
Vitamin A
0µg
2µg
0%
Vitamin B6
0.059mg
0.055mg
0%
Saturated fat
0.051g
0.019g
0%
Monounsaturated fat
0.09g
0.064g
0%
Tryptophan
0.011mg
0%
Lysine
0.06mg
0%
Methionine
0.007mg
0%
Macronutrient Comparison
Macronutrient breakdown side-by-side comparison
2
17%
81%
Protein:
1 g
Fats:
0.3 g
Carbs:
16.84 g
Water:
81.16 g
Other:
0.7 g
3
12%
86%
Protein:
1.2 g
Fats:
0.65 g
Carbs:
11.94 g
Water:
85.75 g
Other:
0.46 g
Contains
more
Carbs Carbs
+41%
Contains
more
Other Other
+52.2%
Contains
more
Protein Protein
+20%
Contains
more
Fats Fats
+116.7%
Fat Type Comparison
Fat type breakdown side-by-side comparison
1
24%
43%
33%
Saturated fat:
Sat. Fat
0.051 g
Monounsaturated fat:
Mono. Fat
0.09 g
Polyunsaturated fat:
Poly. Fat
0.069 g
2
4%
14%
82%
Saturated fat:
Sat. Fat
0.019 g
Monounsaturated fat:
Mono. Fat
0.064 g
Polyunsaturated fat:
Poly. Fat
0.375 g
Contains
more
Mono. Fat Monounsaturated fat
+40.6%
Contains
less
Sat. Fat Saturated fat
-62.7%
Contains
more
Poly. Fat Polyunsaturated fat
+443.5%