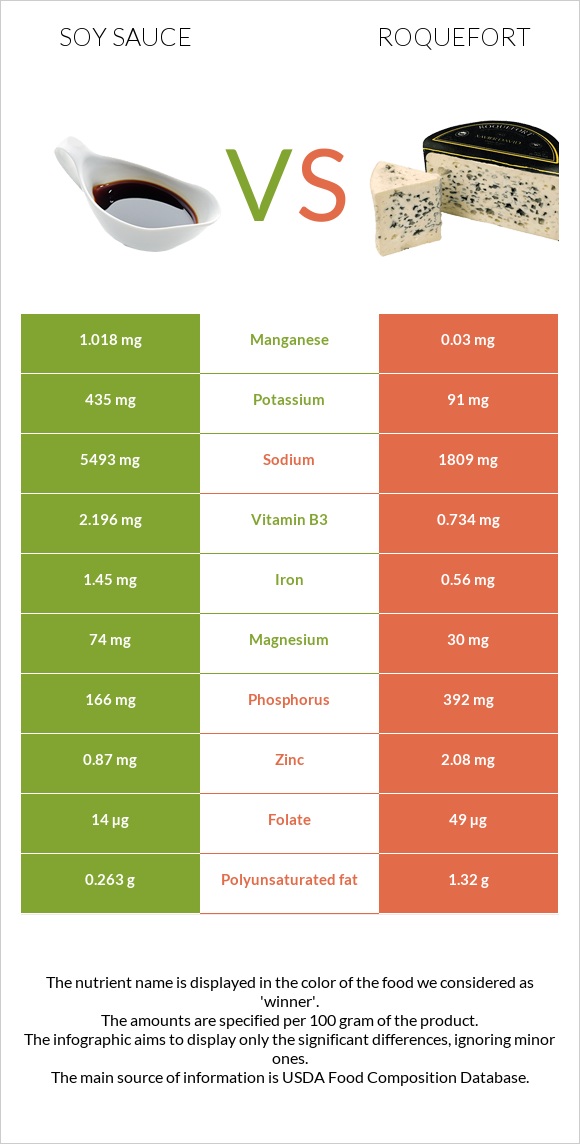
Important differences between soy sauce and roquefort Soy sauce has more manganese; however, roquefort has more calcium, vitamin B2, phosphorus, vitamin B5, vitamin B12, and selenium. Soy sauce's daily need coverage for sodium is 160% more. Soy sauce has 34 times more manganese than roquefort. Soy sauce has 1.018mg of manganese, while roquefort has 0.03mg. Roquefort is lower in sodium. Roquefort has a higher glycemic index than soy sauce. The food varieties used in the comparison are Soy sauce made from soy and wheat (shoyu) and Cheese, roquefort .
Infographic
Mineral Comparison
Mineral comparison score is based on the number of minerals by which one or the other food is richer. The "coverage" charts below show how much of the daily needs can be covered by 300 grams of the food.
5
100 g
300 g
1 tsp - 5.3g 1 individual packet - 8.9g 1 tbsp - 16g 1 cup - 255g
Magnesium
Magnesium
Calcium
Calcium
Potassium
Potassium
Iron
Iron
Copper
Copper
Zinc
Zinc
Phosphorus
Phosphorus
Sodium
Sodium
Manganese
Manganese
Selenium
Selenium
53%
9.9%
38%
54%
14%
24%
71%
716%
133%
2.7%
5
100 g
300 g
1 oz - 28.35g 1 package (3 oz) - 85g
Magnesium
Magnesium
Calcium
Calcium
Potassium
Potassium
Iron
Iron
Copper
Copper
Zinc
Zinc
Phosphorus
Phosphorus
Sodium
Sodium
Manganese
Manganese
Selenium
Selenium
21%
199%
8%
21%
11%
57%
168%
236%
3.9%
79%
Vitamin Comparison
Vitamin comparison score is based on the number of vitamins by which one or the other food is richer. The "coverage" charts below show how much of the daily needs can be covered by 300 grams of the food.
2
100 g
300 g
1 tsp - 5.3g 1 individual packet - 8.9g 1 tbsp - 16g 1 cup - 255g
Vitamin C
Vit. C
Vitamin D
Vit. D
Vitamin A
Vit. A
Vitamin E
Vit. E
Vitamin B1
Vit. B1
Vitamin B2
Vit. B2
Vitamin B3
Vit. B3
Vitamin B5
Vit. B5
Vitamin B6
Vit. B6
Vitamin B12
Vit. B12
Vitamin K
Vit. K
Folate
Folate
0%
0%
0%
0%
8.3%
38%
41%
18%
34%
0%
0%
11%
6
100 g
300 g
1 oz - 28.35g 1 package (3 oz) - 85g
Vitamin C
Vit. C
Vitamin D
Vit. D
Vitamin A
Vit. A
Vitamin E
Vit. E
Vitamin B1
Vit. B1
Vitamin B2
Vit. B2
Vitamin B3
Vit. B3
Vitamin B5
Vit. B5
Vitamin B6
Vit. B6
Vitamin B12
Vit. B12
Vitamin K
Vit. K
Folate
Folate
0%
0%
98%
0%
10%
135%
14%
104%
29%
80%
0%
37%
All nutrients comparison - raw data values
Nutrient
DV% diff.
Sodium
5493mg
1809mg
160%
Saturated fat
0.073g
19.263g
87%
Calcium
33mg
662mg
63%
Fats
0.57g
30.64g
46%
Manganese
1.018mg
0.03mg
43%
Vitamin A
0µg
294µg
33%
Phosphorus
166mg
392mg
32%
Vitamin B2
0.165mg
0.586mg
32%
Cholesterol
0mg
90mg
30%
Vitamin B5
0.297mg
1.731mg
29%
Protein
8.14g
21.54g
27%
Vitamin B12
0µg
0.64µg
27%
Selenium
0.5µg
14.5µg
25%
Monounsaturated fat
0.088g
8.474g
21%
Calories
53kcal
369kcal
16%
Iron
1.45mg
0.56mg
11%
Zinc
0.87mg
2.08mg
11%
Magnesium
74mg
30mg
10%
Potassium
435mg
91mg
10%
Vitamin B3
2.196mg
0.734mg
9%
Folate
14µg
49µg
9%
Polyunsaturated fat
0.263g
1.32g
7%
Fiber
0.8g
0g
3%
Choline
18.3mg
3%
Vitamin B6
0.148mg
0.124mg
2%
Carbs
4.93g
2g
1%
Copper
0.043mg
0.034mg
1%
Vitamin B1
0.033mg
0.04mg
1%
Protein per 100 calories
15g
5.8g
N/A
Calories per 10 g protein
65kcal
171kcal
N/A
Weight per 100 calories
189g
27g
N/A
Unsaturated / Saturated Fat ratio
4.8
0.51
N/A
Net carbs
4.13g
2g
N/A
Sugar
0.4g
N/A
Tryptophan
0.096mg
0.303mg
0%
Threonine
0.271mg
0.965mg
0%
Isoleucine
0.318mg
1.217mg
0%
Leucine
0.537mg
2.114mg
0%
Lysine
0.381mg
1.848mg
0%
Methionine
0.097mg
0.558mg
0%
Phenylalanine
0.353mg
1.023mg
0%
Valine
0.332mg
1.614mg
0%
Histidine
0.174mg
0.602mg
0%
Macronutrient Comparison
Macronutrient breakdown side-by-side comparison
3
8%
5%
71%
15%
Protein:
8.14 g
Fats:
0.57 g
Carbs:
4.93 g
Water:
71.15 g
Other:
15.21 g
2
22%
31%
2%
39%
6%
Protein:
21.54 g
Fats:
30.64 g
Carbs:
2 g
Water:
39.38 g
Other:
6.44 g
Contains
more
Carbs Carbs
+146.5%
Contains
more
Water Water
+80.7%
Contains
more
Other Other
+136.2%
Contains
more
Protein Protein
+164.6%
Contains
more
Fats Fats
+5275.4%
Fat Type Comparison
Fat type breakdown side-by-side comparison
1
17%
21%
62%
Saturated fat:
Sat. Fat
0.073 g
Monounsaturated fat:
Mono. Fat
0.088 g
Polyunsaturated fat:
Poly. Fat
0.263 g
2
66%
29%
5%
Saturated fat:
Sat. Fat
19.263 g
Monounsaturated fat:
Mono. Fat
8.474 g
Polyunsaturated fat:
Poly. Fat
1.32 g
Contains
less
Sat. Fat Saturated fat
-99.6%
Contains
more
Mono. Fat Monounsaturated fat
+9529.5%
Contains
more
Poly. Fat Polyunsaturated fat
+401.9%