Soy yogurt vs. Black turtle bean — In-Depth Nutrition Comparison
Compare
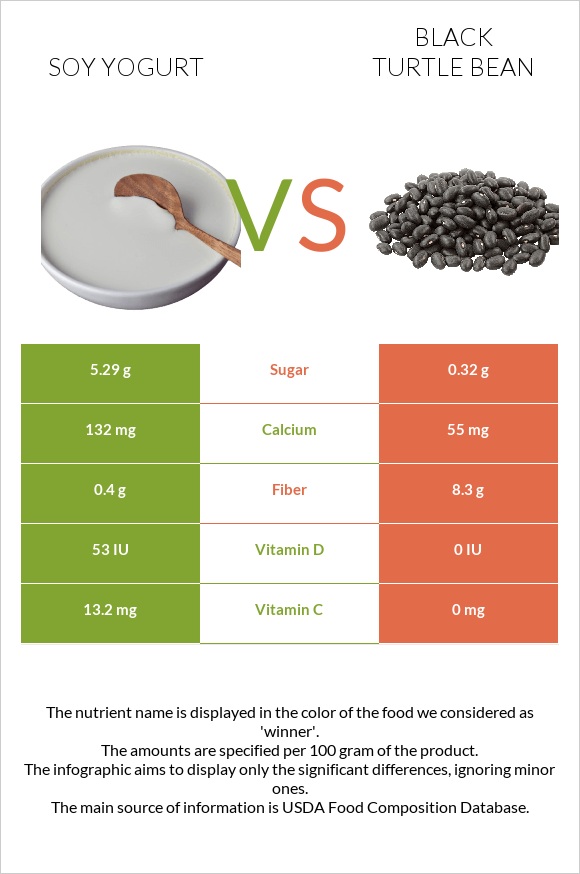
How are soy yogurt and black turtle bean different?
- Soy yogurt is higher in vitamin C, calcium, and vitamin D*; however, black turtle bean is richer in fiber.
- Daily need coverage for fiber for black turtle bean is 32% higher.
- Black turtle bean has less sugar.
SILK Plain soy yogurt and Beans, black turtle, mature seeds, cooked, boiled, without salt are the varieties used in this article.
Infographic
Infographic link
Mineral Comparison
Mineral comparison score is based on the number of minerals by which one or the other food is richer. The "coverage" charts below show how much of the daily needs can be covered by 300 grams of the food.
| Contains more CalciumCalcium | +140% |
| Contains less SodiumSodium | -76.9% |
Vitamin Comparison
Vitamin comparison score is based on the number of vitamins by which one or the other food is richer. The "coverage" charts below show how much of the daily needs can be covered by 300 grams of the food.
| Contains more Vitamin CVitamin C | +∞% |
| Contains more Vitamin DVitamin D | +∞% |
All nutrients comparison - raw data values
| Nutrient |  |
 |
DV% diff. |
| Iron | 2.85mg | 36% | |
| Fiber | 0.4g | 8.3g | 32% |
| Copper | 0.269mg | 30% | |
| Phosphorus | 152mg | 22% | |
| Folate | 86µg | 22% | |
| Vitamin B1 | 0.225mg | 19% | |
| Vitamin C | 13.2mg | 0mg | 15% |
| Manganese | 0.327mg | 14% | |
| Potassium | 433mg | 13% | |
| Magnesium | 49mg | 12% | |
| Protein | 2.64g | 8.18g | 11% |
| Calcium | 132mg | 55mg | 8% |
| Vitamin D* | 53 IU | 0 IU | 7% |
| Vitamin D | 1.3µg | 0µg | 7% |
| Zinc | 0.76mg | 7% | |
| Vitamin E | 0.87mg | 6% | |
| Vitamin B6 | 0.077mg | 6% | |
| Choline | 32.6mg | 6% | |
| Carbs | 9.69g | 24.35g | 5% |
| Vitamin B5 | 0.26mg | 5% | |
| Vitamin B2 | 0.056mg | 4% | |
| Calories | 66kcal | 130kcal | 3% |
| Vitamin B3 | 0.527mg | 3% | |
| Vitamin K | 3.3µg | 3% | |
| Fats | 1.76g | 0.35g | 2% |
| Selenium | 1.2µg | 2% | |
| Saturated fat | 0.22g | 0.089g | 1% |
| Polyunsaturated fat | 0.149g | 1% | |
| Protein per 100 calories | 4g | 6.3g | N/A |
| Calories per 10 g protein | 250kcal | 159kcal | N/A |
| Weight per 100 calories | 152g | 77g | N/A |
| Net carbs | 9.29g | 16.05g | N/A |
| Sugar | 5.29g | 0.32g | N/A |
| Sodium | 13mg | 3mg | 0% |
| Monounsaturated fat | 0.03g | 0% | |
| Tryptophan | 0.097mg | 0% | |
| Threonine | 0.344mg | 0% | |
| Isoleucine | 0.361mg | 0% | |
| Leucine | 0.653mg | 0% | |
| Lysine | 0.562mg | 0% | |
| Methionine | 0.123mg | 0% | |
| Phenylalanine | 0.442mg | 0% | |
| Valine | 0.428mg | 0% | |
| Histidine | 0.228mg | 0% |
Macronutrient Comparison
Macronutrient breakdown side-by-side comparison
Protein:
2.64 g
Fats:
1.76 g
Carbs:
9.69 g
Water:
84.67 g
Other:
1.24 g
Protein:
8.18 g
Fats:
0.35 g
Carbs:
24.35 g
Water:
65.74 g
Other:
1.38 g
| Contains more FatsFats | +402.9% |
| Contains more WaterWater | +28.8% |
| Contains more ProteinProtein | +209.8% |
| Contains more CarbsCarbs | +151.3% |
| Contains more OtherOther | +11.3% |
Fat Type Comparison
Fat type breakdown side-by-side comparison
Saturated fat:
Sat. Fat
0.22 g
Monounsaturated fat:
Mono. Fat
0 g
Polyunsaturated fat:
Poly. Fat
0 g
Saturated fat:
Sat. Fat
0.089 g
Monounsaturated fat:
Mono. Fat
0.03 g
Polyunsaturated fat:
Poly. Fat
0.149 g
| Contains less Sat. FatSaturated fat | -59.5% |


