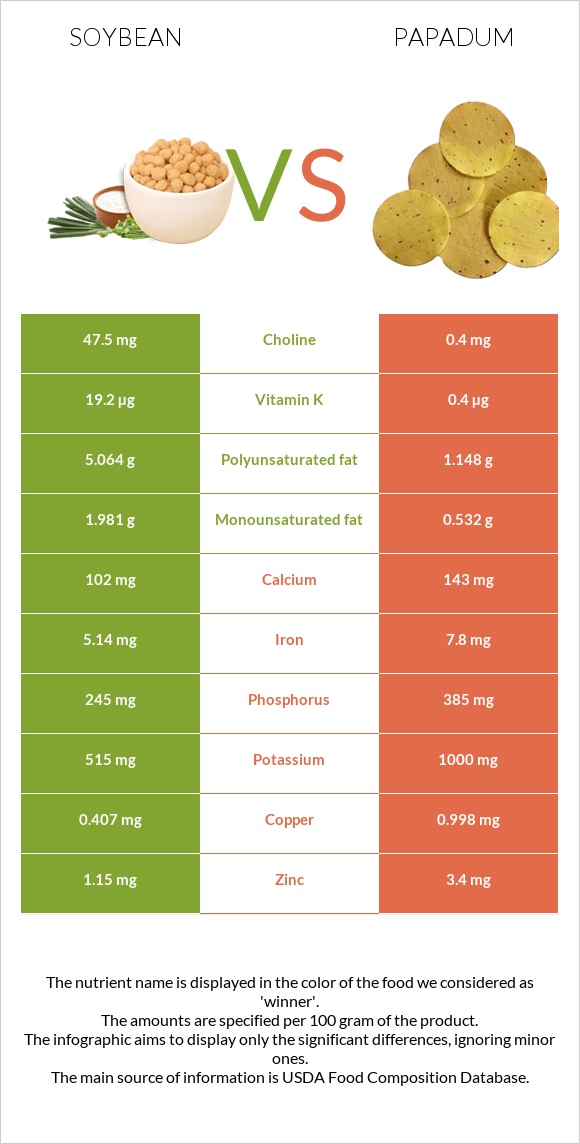
How are soybeans and papadum different? Soybeans are higher in vitamin K; however, papadum is richer in copper, fiber, magnesium, folate, iron, manganese, zinc, and phosphorus. Daily need coverage for sodium for papadum is 76% higher. Soybeans contain 48 times more vitamin K than papadum. While soybeans contain 19.2µg of vitamin K, papadum contains only 0.4µg. Soybeans have less sodium. Soybeans have a lower glycemic index (14) than papadum (46). Soybeans, mature cooked, boiled, without salt and Papad are the varieties used in this article.
Infographic
Mineral Comparison
Mineral comparison score is based on the number of minerals by which one or the other food is richer. The "coverage" charts below show how much of the daily needs can be covered by 300 grams of the food.
1
100 g
300 g
1 tbsp - 10.7g 1 cup - 172g
Magnesium
Magnesium
Calcium
Calcium
Potassium
Potassium
Iron
Iron
Copper
Copper
Zinc
Zinc
Phosphorus
Phosphorus
Sodium
Sodium
Manganese
Manganese
Selenium
Selenium
61%
31%
45%
193%
136%
31%
105%
0.13%
107%
40%
9
100 g
300 g
Magnesium
Magnesium
Calcium
Calcium
Potassium
Potassium
Iron
Iron
Copper
Copper
Zinc
Zinc
Phosphorus
Phosphorus
Sodium
Sodium
Manganese
Manganese
Selenium
Selenium
194%
43%
88%
293%
333%
93%
165%
228%
204%
45%
Vitamin Comparison
Vitamin comparison score is based on the number of vitamins by which one or the other food is richer. The "coverage" charts below show how much of the daily needs can be covered by 300 grams of the food.
3
100 g
300 g
1 tbsp - 10.7g 1 cup - 172g
Vitamin C
Vit. C
Vitamin D
Vit. D
Vitamin A
Vit. A
Vitamin E
Vit. E
Vitamin B1
Vit. B1
Vitamin B2
Vit. B2
Vitamin B3
Vit. B3
Vitamin B5
Vit. B5
Vitamin B6
Vit. B6
Vitamin B12
Vit. B12
Vitamin K
Vit. K
Folate
Folate
5.7%
0%
0%
7%
39%
66%
7.5%
11%
54%
0%
48%
41%
6
100 g
300 g
Vitamin C
Vit. C
Vitamin D
Vit. D
Vitamin A
Vit. A
Vitamin E
Vit. E
Vitamin B1
Vit. B1
Vitamin B2
Vit. B2
Vitamin B3
Vit. B3
Vitamin B5
Vit. B5
Vitamin B6
Vit. B6
Vitamin B12
Vit. B12
Vitamin K
Vit. K
Folate
Folate
0%
0%
4.3%
1%
69%
60%
28%
55%
66%
0%
1%
164%
All nutrients comparison - raw data values
Nutrient
DV% diff.
Sodium
1mg
1745mg
76%
Copper
0.407mg
0.998mg
66%
Fiber
6g
18.6g
50%
Magnesium
86mg
271mg
44%
Folate
54µg
219µg
41%
Iron
5.14mg
7.8mg
33%
Manganese
0.824mg
1.562mg
32%
Polyunsaturated fat
5.064g
1.148g
26%
Zinc
1.15mg
3.4mg
20%
Phosphorus
245mg
385mg
20%
Carbs
8.36g
59.87g
17%
Vitamin K
19.2µg
0.4µg
16%
Protein
18.21g
25.56g
15%
Vitamin B5
0.179mg
0.917mg
15%
Potassium
515mg
1000mg
14%
Calories
172kcal
371kcal
10%
Vitamin B1
0.155mg
0.277mg
10%
Fats
8.97g
3.25g
9%
Choline
47.5mg
0.4mg
9%
Vitamin B3
0.399mg
1.472mg
7%
Calcium
102mg
143mg
4%
Vitamin B6
0.234mg
0.285mg
4%
Monounsaturated fat
1.981g
0.532g
4%
Vitamin C
1.7mg
0mg
2%
Vitamin E
0.35mg
0.05mg
2%
Selenium
7.3µg
8.3µg
2%
Vitamin B2
0.285mg
0.258mg
2%
Cholesterol
0mg
4mg
1%
Vitamin A
0µg
13µg
1%
Saturated fat
1.297g
1.084g
1%
Protein per 100 calories
11g
6.9g
N/A
Calories per 10 g protein
94kcal
145kcal
N/A
Weight per 100 calories
58g
27g
N/A
Unsaturated / Saturated Fat ratio
5.4
1.5
N/A
Net carbs
2.36g
41.27g
N/A
Sugar
3g
0g
N/A
Tryptophan
0.242mg
0.266mg
0%
Threonine
0.723mg
0.886mg
0%
Isoleucine
0.807mg
1.303mg
0%
Leucine
1.355mg
2.115mg
0%
Lysine
1.108mg
1.695mg
0%
Methionine
0.224mg
0.372mg
0%
Phenylalanine
0.869mg
1.491mg
0%
Valine
0.831mg
1.434mg
0%
Histidine
0.449mg
0.715mg
0%
Macronutrient Comparison
Macronutrient breakdown side-by-side comparison
2
18%
9%
8%
63%
2%
Protein:
18.21 g
Fats:
8.97 g
Carbs:
8.36 g
Water:
62.55 g
Other:
1.91 g
3
26%
3%
60%
3%
8%
Protein:
25.56 g
Fats:
3.25 g
Carbs:
59.87 g
Water:
3.49 g
Other:
7.83 g
Contains
more
Fats Fats
+176%
Contains
more
Water Water
+1692.3%
Contains
more
Protein Protein
+40.4%
Contains
more
Carbs Carbs
+616.1%
Contains
more
Other Other
+309.9%
Fat Type Comparison
Fat type breakdown side-by-side comparison
2
16%
24%
61%
Saturated fat:
Sat. Fat
1.297 g
Monounsaturated fat:
Mono. Fat
1.981 g
Polyunsaturated fat:
Poly. Fat
5.064 g
1
39%
19%
42%
Saturated fat:
Sat. Fat
1.084 g
Monounsaturated fat:
Mono. Fat
0.532 g
Polyunsaturated fat:
Poly. Fat
1.148 g
Contains
more
Mono. Fat Monounsaturated fat
+272.4%
Contains
more
Poly. Fat Polyunsaturated fat
+341.1%
Contains
less
Sat. Fat Saturated fat
-16.4%