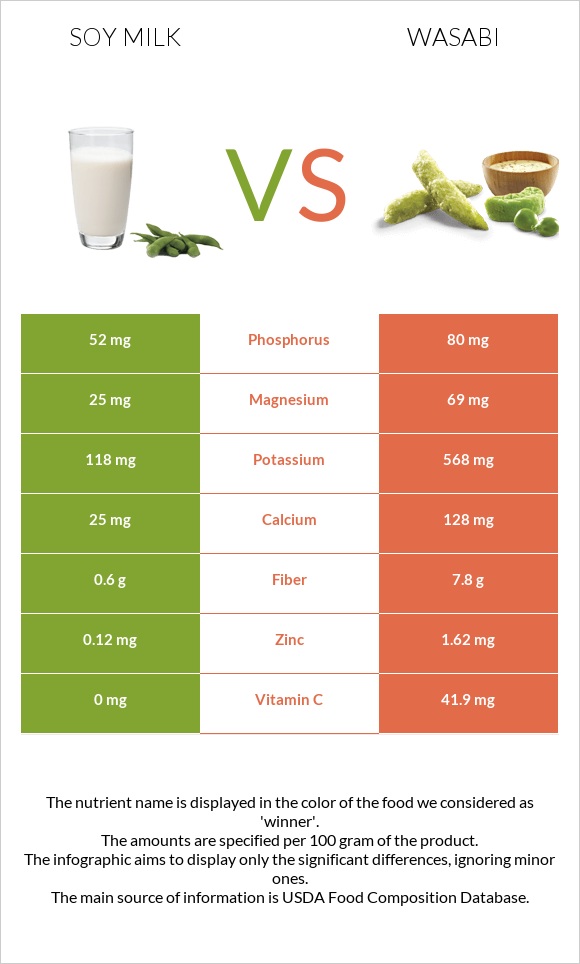
Significant differences between soy milk and wasabi Wasabi is richer than soy milk in vitamin C, fiber, vitamin B6, zinc, potassium, magnesium, calcium, manganese, and vitamin B1. Wasabi covers your daily vitamin C needs 47% more than soy milk. Specific food types used in this comparison are Soymilk, original, and vanilla, unfortified and Wasabi, root, raw .
Infographic
Mineral Comparison
Mineral comparison score is based on the number of minerals by which one or the other food is richer. The "coverage" charts below show how much of the daily needs can be covered by 300 grams of the food.
1
100 g
300 g
1 fl oz - 30.6g 1 cup - 243g
Magnesium
Magnesium
Calcium
Calcium
Potassium
Potassium
Iron
Iron
Copper
Copper
Zinc
Zinc
Phosphorus
Phosphorus
Sodium
Sodium
Manganese
Manganese
Selenium
Selenium
18%
7.5%
10%
24%
43%
3.3%
22%
6.7%
29%
26%
9
100 g
300 g
1 cup, sliced - 130g 1 root - 169g
Magnesium
Magnesium
Calcium
Calcium
Potassium
Potassium
Iron
Iron
Copper
Copper
Zinc
Zinc
Phosphorus
Phosphorus
Sodium
Sodium
Manganese
Manganese
Selenium
Selenium
49%
38%
50%
39%
52%
44%
34%
2.2%
51%
0%
Vitamin Comparison
Vitamin comparison score is based on the number of vitamins by which one or the other food is richer. The "coverage" charts below show how much of the daily needs can be covered by 300 grams of the food.
3
100 g
300 g
1 fl oz - 30.6g 1 cup - 243g
Vitamin C
Vit. C
Vitamin D
Vit. D
Vitamin A
Vit. A
Vitamin E
Vit. E
Vitamin B1
Vit. B1
Vitamin B2
Vit. B2
Vitamin B3
Vit. B3
Vitamin B5
Vit. B5
Vitamin B6
Vit. B6
Vitamin B12
Vit. B12
Vitamin K
Vit. K
Folate
Folate
0%
0%
0%
2.2%
15%
16%
9.6%
22%
18%
0%
7.5%
14%
6
100 g
300 g
1 cup, sliced - 130g 1 root - 169g
Vitamin C
Vit. C
Vitamin D
Vit. D
Vitamin A
Vit. A
Vitamin E
Vit. E
Vitamin B1
Vit. B1
Vitamin B2
Vit. B2
Vitamin B3
Vit. B3
Vitamin B5
Vit. B5
Vitamin B6
Vit. B6
Vitamin B12
Vit. B12
Vitamin K
Vit. K
Folate
Folate
140%
0%
0.67%
0%
33%
26%
14%
12%
63%
0%
0%
14%
All nutrients comparison - raw data values
Nutrient
DV% diff.
Vitamin C
0mg
41.9mg
47%
Fiber
0.6g
7.8g
29%
Vitamin B6
0.077mg
0.274mg
15%
Zinc
0.12mg
1.62mg
14%
Potassium
118mg
568mg
13%
Magnesium
25mg
69mg
10%
Calcium
25mg
128mg
10%
Selenium
4.8µg
9%
Manganese
0.223mg
0.391mg
7%
Carbs
6.28g
23.54g
6%
Vitamin B1
0.06mg
0.131mg
6%
Polyunsaturated fat
0.961g
6%
Iron
0.64mg
1.03mg
5%
Phosphorus
52mg
80mg
4%
Choline
23.6mg
4%
Calories
54kcal
109kcal
3%
Protein
3.27g
4.8g
3%
Copper
0.128mg
0.155mg
3%
Vitamin B2
0.069mg
0.114mg
3%
Vitamin B5
0.373mg
0.203mg
3%
Vitamin K
3µg
3%
Fats
1.75g
0.63g
2%
Sodium
51mg
17mg
1%
Vitamin E
0.11mg
1%
Vitamin B3
0.513mg
0.743mg
1%
Saturated fat
0.205g
1%
Monounsaturated fat
0.401g
1%
Protein per 100 calories
6.1g
4.4g
N/A
Calories per 10 g protein
165kcal
227kcal
N/A
Weight per 100 calories
185g
92g
N/A
Net carbs
5.68g
15.74g
N/A
Sugar
3.99g
N/A
Vitamin A
0µg
2µg
0%
Folate
18µg
18µg
0%
Tryptophan
0.038mg
0%
Threonine
0.108mg
0%
Isoleucine
0.114mg
0%
Leucine
0.186mg
0%
Lysine
0.131mg
0%
Methionine
0.027mg
0%
Phenylalanine
0.113mg
0%
Valine
0.117mg
0%
Histidine
0.061mg
0%
Macronutrient Comparison
Macronutrient breakdown side-by-side comparison
2
3%
2%
6%
88%
Protein:
3.27 g
Fats:
1.75 g
Carbs:
6.28 g
Water:
88.05 g
Other:
0.65 g
3
5%
24%
69%
2%
Protein:
4.8 g
Fats:
0.63 g
Carbs:
23.54 g
Water:
69.11 g
Other:
1.92 g
Contains
more
Fats Fats
+177.8%
Contains
more
Water Water
+27.4%
Contains
more
Protein Protein
+46.8%
Contains
more
Carbs Carbs
+274.8%
Contains
more
Other Other
+195.4%