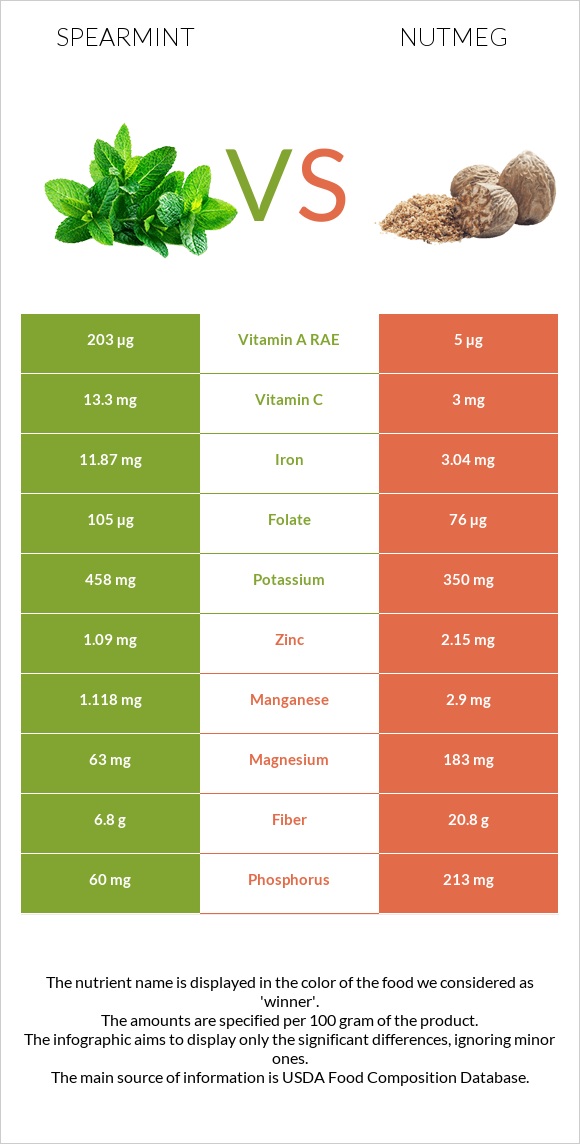
Significant differences between spearmint and nutmeg Spearmint has more iron, vitamin A, and vitamin C; however, nutmeg is richer in copper, manganese, fiber, magnesium, vitamin B1, and phosphorus. Nutmeg covers your daily saturated fat needs 129% more than spearmint. Nutmeg has 40 times less vitamin A than spearmint. Spearmint has 4054 IU of vitamin A, while nutmeg has 102 IU. Spearmint contains less saturated fat. Specific food types used in this comparison are Spearmint, fresh and Spices, nutmeg, ground .
Infographic
Mineral Comparison
Mineral comparison score is based on the number of minerals by which one or the other food is richer. The "coverage" charts below show how much of the daily needs can be covered by 300 grams of the food.
2
100 g
300 g
2 leaves - 0.3g 2 tbsp - 11.4g
Magnesium
Magnesium
Calcium
Calcium
Potassium
Potassium
Iron
Iron
Copper
Copper
Zinc
Zinc
Phosphorus
Phosphorus
Sodium
Sodium
Manganese
Manganese
Selenium
Selenium
45%
60%
40%
445%
80%
30%
26%
3.9%
146%
0%
7
100 g
300 g
0.25 tsp - 0.5g 1 tbsp - 7g
Magnesium
Magnesium
Calcium
Calcium
Potassium
Potassium
Iron
Iron
Copper
Copper
Zinc
Zinc
Phosphorus
Phosphorus
Sodium
Sodium
Manganese
Manganese
Selenium
Selenium
131%
55%
31%
114%
342%
59%
91%
2.1%
378%
8.7%
Vitamin Comparison
Vitamin comparison score is based on the number of vitamins by which one or the other food is richer. The "coverage" charts below show how much of the daily needs can be covered by 300 grams of the food.
5
100 g
300 g
2 leaves - 0.3g 2 tbsp - 11.4g
Vitamin C
Vit. C
Vitamin D
Vit. D
Vitamin A
Vit. A
Vitamin E
Vit. E
Vitamin B1
Vit. B1
Vitamin B2
Vit. B2
Vitamin B3
Vit. B3
Vitamin B5
Vit. B5
Vitamin B6
Vit. B6
Vitamin B12
Vit. B12
Vitamin K
Vit. K
Folate
Folate
44%
0%
68%
0%
20%
40%
18%
15%
36%
0%
0%
79%
2
100 g
300 g
0.25 tsp - 0.5g 1 tbsp - 7g
Vitamin C
Vit. C
Vitamin D
Vit. D
Vitamin A
Vit. A
Vitamin E
Vit. E
Vitamin B1
Vit. B1
Vitamin B2
Vit. B2
Vitamin B3
Vit. B3
Vitamin B5
Vit. B5
Vitamin B6
Vit. B6
Vitamin B12
Vit. B12
Vitamin K
Vit. K
Folate
Folate
10%
0%
1.7%
0%
87%
13%
24%
0%
37%
0%
0%
57%
All nutrients comparison - raw data values
Nutrient
DV% diff.
Saturated fat
0.191g
25.94g
117%
Iron
11.87mg
3.04mg
110%
Copper
0.24mg
1.027mg
87%
Manganese
1.118mg
2.9mg
77%
Fiber
6.8g
20.8g
56%
Fats
0.73g
36.31g
55%
Magnesium
63mg
183mg
29%
Calories
44kcal
525kcal
24%
Phosphorus
60mg
213mg
22%
Vitamin A
203µg
5µg
22%
Vitamin B1
0.078mg
0.346mg
22%
Carbs
8.41g
49.29g
14%
Vitamin C
13.3mg
3mg
11%
Zinc
1.09mg
2.15mg
10%
Vitamin B2
0.175mg
0.057mg
9%
Monounsaturated fat
0.025g
3.22g
8%
Folate
105µg
76µg
7%
Protein
3.29g
5.84g
5%
Vitamin B5
0.25mg
5%
Potassium
458mg
350mg
3%
Selenium
1.6µg
3%
Calcium
199mg
184mg
2%
Vitamin B3
0.948mg
1.299mg
2%
Choline
8.8mg
2%
Sodium
30mg
16mg
1%
Protein per 100 calories
7.5g
1.1g
N/A
Calories per 10 g protein
134kcal
899kcal
N/A
Weight per 100 calories
227g
19g
N/A
Unsaturated / Saturated Fat ratio
2.2
0.14
N/A
Net carbs
1.61g
28.49g
N/A
Sugar
2.99g
N/A
Vitamin B6
0.158mg
0.16mg
0%
Polyunsaturated fat
0.394g
0.35g
0%
Tryptophan
0.05mg
0%
Threonine
0.135mg
0%
Isoleucine
0.135mg
0%
Leucine
0.247mg
0%
Lysine
0.141mg
0%
Methionine
0.046mg
0%
Phenylalanine
0.168mg
0%
Valine
0.164mg
0%
Histidine
0.066mg
0%
Macronutrient Comparison
Macronutrient breakdown side-by-side comparison
1
3%
8%
86%
2%
Protein:
3.29 g
Fats:
0.73 g
Carbs:
8.41 g
Water:
85.55 g
Other:
2.02 g
4
6%
36%
49%
6%
2%
Protein:
5.84 g
Fats:
36.31 g
Carbs:
49.29 g
Water:
6.23 g
Other:
2.33 g
Contains
more
Water Water
+1273.2%
Contains
more
Protein Protein
+77.5%
Contains
more
Fats Fats
+4874%
Contains
more
Carbs Carbs
+486.1%
Contains
more
Other Other
+15.3%
Fat Type Comparison
Fat type breakdown side-by-side comparison
2
31%
4%
65%
Saturated fat:
Sat. Fat
0.191 g
Monounsaturated fat:
Mono. Fat
0.025 g
Polyunsaturated fat:
Poly. Fat
0.394 g
1
88%
11%
Saturated fat:
Sat. Fat
25.94 g
Monounsaturated fat:
Mono. Fat
3.22 g
Polyunsaturated fat:
Poly. Fat
0.35 g
Contains
less
Sat. Fat Saturated fat
-99.3%
Contains
more
Poly. Fat Polyunsaturated fat
+12.6%
Contains
more
Mono. Fat Monounsaturated fat
+12780%