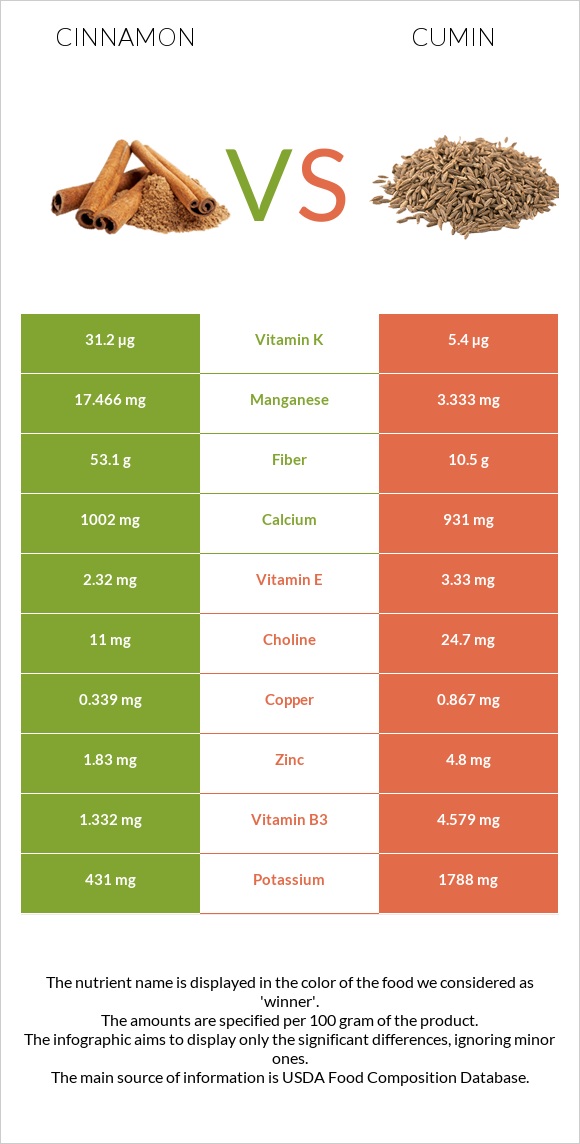
The main differences between cinnamon and cumin Cinnamon has more manganese and fiber; however, cumin has more iron, magnesium, phosphorus, copper, vitamin B1, potassium, zinc, and vitamin B2. Daily need coverage for iron for cumin is 726% higher. Cumin has 5 times less manganese than cinnamon. Cinnamon has 17.466mg of manganese, while cumin has 3.333mg. Food types used in this article are Spices, cinnamon, ground and Spices, cumin seed .
Infographic
Mineral Comparison
Mineral comparison score is based on the number of minerals by which one or the other food is richer. The "coverage" charts below show how much of the daily needs can be covered by 300 grams of the food.
2
100 g
300 g
0.25 tsp - 0.5g 1 tbsp - 7.8g
Magnesium
Magnesium
Calcium
Calcium
Potassium
Potassium
Iron
Iron
Copper
Copper
Zinc
Zinc
Phosphorus
Phosphorus
Sodium
Sodium
Manganese
Manganese
Selenium
Selenium
43%
301%
38%
312%
113%
50%
27%
1.3%
2278%
17%
7
100 g
300 g
0.25 tsp, whole - 0.5g 1 tbsp, whole - 6g
Magnesium
Magnesium
Calcium
Calcium
Potassium
Potassium
Iron
Iron
Copper
Copper
Zinc
Zinc
Phosphorus
Phosphorus
Sodium
Sodium
Manganese
Manganese
Selenium
Selenium
261%
279%
158%
2489%
289%
131%
214%
22%
435%
28%
Vitamin Comparison
Vitamin comparison score is based on the number of vitamins by which one or the other food is richer. The "coverage" charts below show how much of the daily needs can be covered by 300 grams of the food.
2
100 g
300 g
0.25 tsp - 0.5g 1 tbsp - 7.8g
Vitamin C
Vit. C
Vitamin D
Vit. D
Vitamin A
Vit. A
Vitamin E
Vit. E
Vitamin B1
Vit. B1
Vitamin B2
Vit. B2
Vitamin B3
Vit. B3
Vitamin B5
Vit. B5
Vitamin B6
Vit. B6
Vitamin B12
Vit. B12
Vitamin K
Vit. K
Folate
Folate
13%
0%
5%
46%
5.5%
9.5%
25%
21%
36%
0%
78%
4.5%
8
100 g
300 g
0.25 tsp, whole - 0.5g 1 tbsp, whole - 6g
Vitamin C
Vit. C
Vitamin D
Vit. D
Vitamin A
Vit. A
Vitamin E
Vit. E
Vitamin B1
Vit. B1
Vitamin B2
Vit. B2
Vitamin B3
Vit. B3
Vitamin B5
Vit. B5
Vitamin B6
Vit. B6
Vitamin B12
Vit. B12
Vitamin K
Vit. K
Folate
Folate
26%
0%
21%
67%
157%
75%
86%
0%
100%
0%
14%
7.5%
All nutrients comparison - raw data values
Nutrient
DV% diff.
Iron
8.32mg
66.36mg
726%
Manganese
17.466mg
3.333mg
614%
Fiber
53.1g
10.5g
170%
Magnesium
60mg
366mg
73%
Phosphorus
64mg
499mg
62%
Copper
0.339mg
0.867mg
59%
Vitamin B1
0.022mg
0.628mg
51%
Potassium
431mg
1788mg
40%
Monounsaturated fat
0.246g
14.04g
34%
Fats
1.24g
22.27g
32%
Protein
3.99g
17.81g
28%
Zinc
1.83mg
4.8mg
27%
Vitamin B2
0.041mg
0.327mg
22%
Vitamin K
31.2µg
5.4µg
22%
Vitamin B6
0.158mg
0.435mg
21%
Polyunsaturated fat
0.068g
3.279g
21%
Vitamin B3
1.332mg
4.579mg
20%
Carbs
80.59g
44.24g
12%
Calcium
1002mg
931mg
7%
Sodium
10mg
168mg
7%
Vitamin E
2.32mg
3.33mg
7%
Vitamin B5
0.358mg
7%
Calories
247kcal
375kcal
6%
Vitamin A
15µg
64µg
5%
Saturated fat
0.345g
1.535g
5%
Vitamin C
3.8mg
7.7mg
4%
Selenium
3.1µg
5.2µg
4%
Choline
11mg
24.7mg
2%
Folate
6µg
10µg
1%
Fructose
1.11g
1%
Protein per 100 calories
1.6g
4.7g
N/A
Calories per 10 g protein
619kcal
211kcal
N/A
Weight per 100 calories
40g
27g
N/A
Unsaturated / Saturated Fat ratio
0.91
11
N/A
Net carbs
27.49g
33.74g
N/A
Sugar
2.17g
2.25g
N/A
Tryptophan
0.049mg
0%
Threonine
0.136mg
0%
Isoleucine
0.146mg
0%
Leucine
0.253mg
0%
Lysine
0.243mg
0%
Methionine
0.078mg
0%
Phenylalanine
0.146mg
0%
Valine
0.224mg
0%
Histidine
0.117mg
0%
Omega-3 - ALA
0.011g
N/A
Macronutrient Comparison
Macronutrient breakdown side-by-side comparison
2
4%
81%
11%
4%
Protein:
3.99 g
Fats:
1.24 g
Carbs:
80.59 g
Water:
10.58 g
Other:
3.6 g
3
18%
22%
44%
8%
8%
Protein:
17.81 g
Fats:
22.27 g
Carbs:
44.24 g
Water:
8.06 g
Other:
7.62 g
Contains
more
Carbs Carbs
+82.2%
Contains
more
Water Water
+31.3%
Contains
more
Protein Protein
+346.4%
Contains
more
Fats Fats
+1696%
Contains
more
Other Other
+111.7%
Fat Type Comparison
Fat type breakdown side-by-side comparison
1
52%
37%
10%
Saturated fat:
Sat. Fat
0.345 g
Monounsaturated fat:
Mono. Fat
0.246 g
Polyunsaturated fat:
Poly. Fat
0.068 g
2
8%
74%
17%
Saturated fat:
Sat. Fat
1.535 g
Monounsaturated fat:
Mono. Fat
14.04 g
Polyunsaturated fat:
Poly. Fat
3.279 g
Contains
less
Sat. Fat Saturated fat
-77.5%
Contains
more
Mono. Fat Monounsaturated fat
+5607.3%
Contains
more
Poly. Fat Polyunsaturated fat
+4722.1%